


November 2015
All examples in this report are hypothetical interpretations of situations and are used for explanation purposes only. The views in this report reflect solely those of the author and not necessarily those of CME Group or its affiliated institutions. This report and the information herein should not be considered investment advice or the results of actual market experience.
The past year has been characterized by the following:
- Lower crude oil and natural gas prices.
- Falling prices for most industrial and precious metals.
- A stronger U.S. dollar, particularly against emerging market currencies.
- Reduced expectations of a Fed rate hike.
The past twelve months have been difficult ones for commodities for two reasons: soaring supplies and softening demand growth. Between 2002 and 2014, many commodities saw price increases of 300-500%. The rise in prices spurred an investment boom that resulted in higher levels of production. Unfortunately for commodity producers, these new sources of supply have come on-line at a time when Chinese economic growth is slowing, resulting in much lower commodity prices and, in many cases, soaring levels of inventory. The reality of lower commodity prices is driving much of Latin America, the Middle East and Russia into recession, further dampening demand.
To a large extent commodity prices already reflect weaker demand from emerging markets, higher levels of production and soaring inventories. It is probably too early to say if the bear market in commodities is over. As such, we prefer to take it on a case-by-case basis, examining the specifics of each market.
Energy: Crude Oil and Natural Gas are in Very Different States
After collapsing late last year, crude oil has staged several failed recoveries. The essential problem in crude oil is simple: the market hasn’t cleared stockpiles. Inventories of crude oil are still about 25% higher today than they were one year ago. Inventories of distillates (mainly ultra-low sulfur diesel) and gasoline are up about 18% and 8% year-on-year, respectively. On the production side, it still isn’t clear that a large amount of U.S. production has come off-line. Lastly, Iranian production, which never entirely left the market despite the sanctions regime, will likely increase a bit after the sanctions are lifted early next year. If it were just up to these factors, it would be easy to expect oil prices continuing to decline into the $20-$40 range – a possibility that we cannot exclude.
There are increasing upside risks to petroleum as well. The most obvious and well understood is the possibility that some U.S. producers could begin to reduce their production in 2016. More difficult to evaluate are the geopolitical risks. Some oil producers have lost as much as 10%-25% of GDP-equivalent worth of revenue. While certain states such as Saudi Arabia, Kuwait, the U.A.E. and Bahrain have enormous currency reserves relative to the size of their economies and can weather lower energy prices for a while, other nations are less protected. These less financially secure nations include Angola, Azerbaijan, Iraq, Nigeria, Oman, and Venezuela. Instability in these countries could easily trigger a sharp spike in crude oil prices that could reverse recent declines. Moreover, even the financially secure nations of the Persian Gulf region are faced with potentially destabilizing conflicts, including the civil war in Yemen in which Saudi Arabia is heavily involved, and the fighting in Iraq and Syria, which is essentially a proxy war between the Sunni Arab Gulf Nations and Iran.
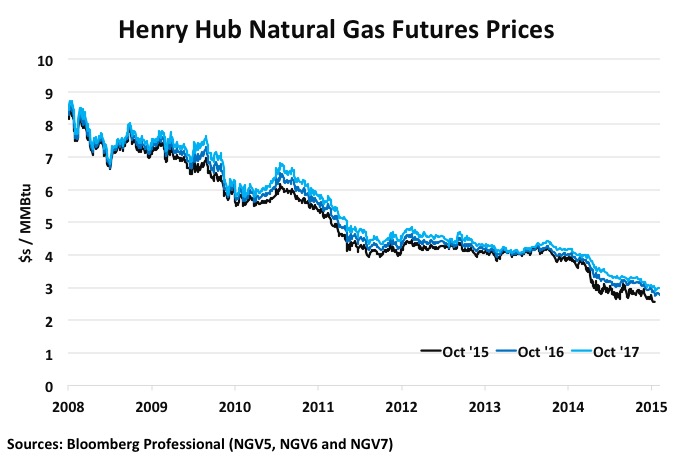
Natural gas is a different entity. Unlike crude oil, whose bear market only began in earnest in November 2014, U.S. natural gas prices have been falling for years. The collapse in U.S. natural gas prices hasn’t yet deterred increases in shale production, which continues to rise albeit at a reduced pace. Production from sources other than shale, however, continues to decline. Additionally, investment in future shale production has collapsed and growth in shale output associated with oil wells risks tapering off as well.
Meanwhile, long-term demand growth for natural gas remains strong, particularly among electrical utilities. Moreover, a number of liquefied natural gas (LNG) export facilities are set to open starting with Cheniere Sabine Pass late this year or early next year. Initially, these export facilities will have a capacity about a 2.3% of total U.S. production in 2016 but if all of the proposed facilities come on-line by 2020, their capacity could total close to 20% of U.S. production. While the viability of LNG exports depend on a large spread between U.S. and global prices (notably Asian prices), at the very least it should put a floor under the U.S. price, making it harder for natural gas prices to drift lower than would otherwise have been the case.
Short-term natural gas has issues: storage levels are high and El Nino might produce a warmer-than-normal winter in the Northern United States and Canada, which could depress demand. These impacts may be already reflected in prices, however. Finally, El Nino can also produce much warmer-than-normal summers, which could boost demand for natural gas in 2016. As such, we consider that the downtrend in natural gas prices is at high risk of reversing and would not rule out significant spikes in prices in 2016 and 2017. Remember, natural gas peaked at over $15/mmBtu in 2005 and it has a lot of potential for upside volatility that doesn’t appear to be priced into either the futures or options curves.
Metal
Metals are a diverse lot. Some metals like iron ore appear to have bottomed as long as six months ago (although one can’t exclude further downside). Others like platinum and copper have continued to decline, while metals like gold and palladium have found support.
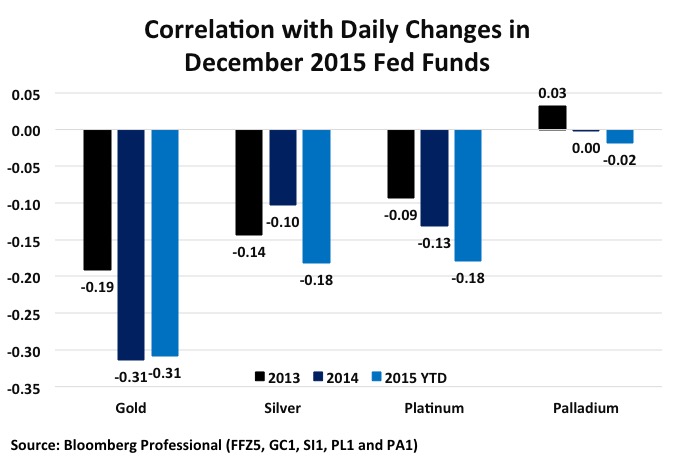
One metal that concerns us is gold. Gold might resume its bear market, which began four years ago. Gold correlates negatively with movements in the implied interest rate on Fed Funds Futures. During the past year the yellow metal appears to have benefitted from the decline in expectations that the U.S. Federal Reserve will tighten monetary policy. That expectation probably doesn’t have much further to move and once it stabilizes or moves in the other direction, gold will be vulnerable to further declines.
The other major driver of gold prices is mining supply. With respect to supply, we continue to hear reports that gold mining supply is about to peak and will begin to decline. We don’t believe this. Gold prices remain significantly above the all-in costs of running a mine (around $980/ounce) and the cash-flow costs (around $680/ounce). This leads us to believe that gold supply is likely to continue to rise and risks putting further downward pressure on prices.
The U.S. Dollar and Its Peers
The U.S. dollar has been soaring against most emerging-market and commodity-producing currencies this year but has lost upside momentum against its non-commodity producing peers such as the euro and yen. This may change going forward. Certain emerging market currencies, notably the Brazilian real, may be oversold and could be nearing a bottom.
The U.S. dollar (USD) could resume its uptrend versus the euro and yen. Part of the reason why USD stopped advancing against these other currencies is that Fed rate hike expectations have diminished. Now, expectations for a Fed rate hike are so low that it won’t be hard for the Fed to exceed these low expectations. If the Fed does hike further or faster than what markets currently price, it could send the USD back up versus the euro and yen and could also cause it to continue its rally versus developed market commodity currencies such as the Canadian and Australian dollars.
U.S. Short Term Rates
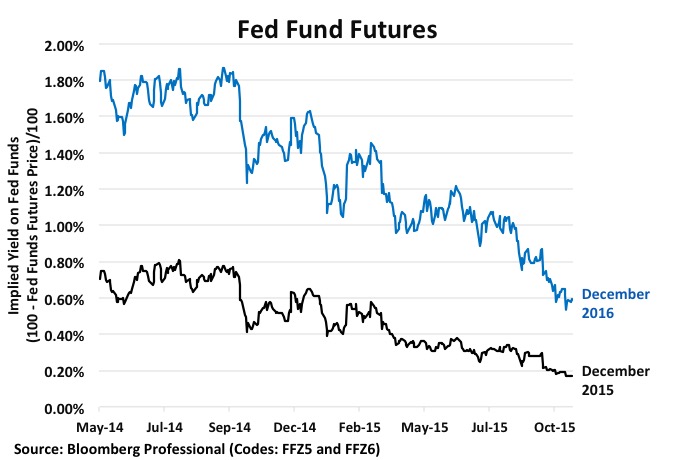
Fed Funds Futures have been rallying for most of 2015 and have de-priced any rate hike this year. The latest boost to Fed Funds prices came from the weaker-than-consensus September employment and retail sales reports. Since the September employment report, however, initial jobless claims have fallen to their lowest levels since 1973, indicating that very few people are being laid off. As such, it might be that the weak September report was an anomaly and that headline jobs numbers will rebound in coming months. Moreover, retail sales were weak in September but this came after several months of strong growth.
More broadly, the U.S. economy continues to grow solidly. There are about 2% more jobs today than one year ago and average earnings are also up around 2.2%. This gives a 4.2% increase in total labor income, which should be enough to sustain the economic recovery.
Ultimately, the Fed would like to bring the Fed Funds target rate up towards the core rate of inflation, which is 1.3% on the core PCE deflator, the central bank’s preferred measure of inflation. As of October 19, Fed Funds are pricing rates at only 0.59% for the end of 2016 and 1.07% by the end of 2017. These are values that could easily be exceeded.