


Blu Putnam is the Chief Economist at CME group. In this interview with high volume futures and options commodities broker, Advantage Futures , Blu Putnam talks about the various factors that will decide the economic activity in 2018.
All examples in this report are hypothetical interpretations of situations and are used for explanation purposes only. The views in this report reflect solely those of the author(s) and not necessarily those of CME Group or its affiliated institutions. This report and the information herein should not be considered investment advice or the results of actual market experience.
With unemployment low and inflation expectations creeping higher, the US Federal Reserve (Fed) may hike rates two or three times in 2018, and Treasury bond yields might drift a little higher. The big caveat is that this consensus scenario will only happen if inflation actually follows the script and starts to rise. Dr. Janet Yellen may no longer be Chair of the Board of Governors of the Federal Reserve System (Fed); however, the Powell-led Fed and bond market participants are likely to remain just as data dependent as in the Yellen-led Fed.
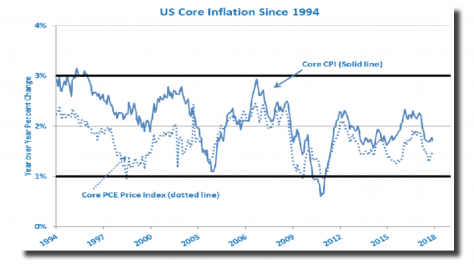
Inflation has been subdued for over two decades. This is not a recent phenomenon and is not due to the lagged impact of the 2008 financial panic. Indeed, whether measured by the consumer price index (CPI) or the Fed’s favorite personal consumption price deflator (PCE), core inflation which excludes the more volatile food and energy categories has been stuck in a 1% to 3% range in the US since 1994. During this 24-year period, we saw two big cycles in unemployment; a stock market tech rally and tech wreck; a housing boom and massive housing recession; short-term rates above 5% as well as near zero; plus some massive Fed experiments with unconventional monetary policy (i.e., asset purchases or quantitative easing, QE). Thus, to evaluate different scenarios for inflation going forward, we need to step back and examine the underlying causes of this more than two decades of subdued inflation. In so doing, we will look at a number of simplified theories of inflation forecasting. By examining their often heroic (and incorrect) assumptions, we will get a much improved sense of why most inflation theories totally failed to have any predictive value, why the Fed is data dependent and why the rate outlook remains cloudy.
Our central thesis comes straight from basic economics: Price rises (i.e., inflation) occur when spending demand exceeds the supply of goods and services. As we take a tour of various approaches to inflation forecasting, we will highlight the changing patterns in the demand for spending or the supply of goods and services. A common theme will be that structural changes in our information-age economy vastly changed how spending demand is created and how goods and services are supplied. The results of these information-age pattern shifts have effectively rendered virtually all of the simplified inflation forecasting approaches useless.
Monetary policy is now less relevant to the real economy
In the 1950s and 1960s, Professor Milton Friedman of the University of Chicago became famous for his research on the money supply as the primary cause of inflation—even if the lags in monetary policy were long and variable. The monetarist theory of inflation fit the inflation data exceptionally well during the 1960s and 1970s, but it fell apart in the late 1980s and never regained any empirical support in later decades.
What went awry with the monetarist theory? The assumed relationship between the money supply and spending demand totally broke down. Back in the 1950s, if one wanted to buy goods or services, one paid with cash or with a check drawn on a basic bank account that paid no interest. There were savings accounts in the 1950s, yet they did not have check-writing privileges. Credit card use was minimal and the ability to borrow through a credit card was constrained. The ability to move funds instantly and efficiently from investment accounts to payment accounts was a dream. Neither cash management nor brokerage accounts allowed check writing. The ability to transfer money over the internet or with a smartphone was not possible. In this bygone era, the money supply was very tightly correlated to spending, and thus rapid increases in the money supply served as a good predictor of future spending and future inflation—assuming the supply of goods and services was constrained to grow at a slower rate than the money supply growth.
The 1980s and subsequent decades ushered in massive change in the way spending demand was created and severed the link with any and all measures of the money supply. Checking accounts were allowed to pay interest. Checks could be written on brokerage accounts. Credit cards came with lines of credit to be used (up to a limit) at the discretion of the spender. These changes in how spending was facilitated were enough to destroy the correlation of money supply measure with inflation, and the Fed stopped setting money supply target ranges in the late 1980s. Then came the 1990s and subsequent decades. The information age brought myriad ways to transfer money and manage credit, including smartphones and internet.
The story does not stop here, though. Even if the measured money supply was no longer a good predictor of future inflation, one might still expect interest rate policy or quantitative easing to have an influence on future inflation. Yet, neither interest rate policy nor central bank asset purchases have produced any evidence of correlation with inflation for almost two and a half decades.
There seem to be two critical forces at work that have contributed to the lack of influence of monetary policy over inflation and the real economy since the early 1990s. The first is increased prudential bank regulation focused on capital requirements. The second is the rise of sophisticated interest rate risk management in the financial sector.
When banks and other lending institutions are capital constrained by prudential regulations, they are unable to expand credit which could drive spending demand. Even if short-term interest rates are relatively low and below the prevailing inflation rate, credit growth will be constrained by capital requirements. Even if the Fed buys massive quantities of US Treasury and mortgage-backed securities, bank lending will be constrained by capital requirements. The rise of prudential regulation to safeguard the financial system, which gained substantial momentum after the collapse of the savings and loan institutions in the recession of 1989-1991, had the unintended consequence of making monetary policy less effective in terms of inflation management. As the policy pendulum swung toward bank regulation, the influence of central bank macro-economic tools waned. The embedded assumption by most academic economists in their macro-economic models that the policy environment is stable and has no influence on the efficacy of monetary policy could not be more wrong.
The Savings & Loan (S&L) crisis of 1990-1991 also had another impact. S&L’s were basically institutions that borrowed short-term (savings accounts) and lent longer-term (home mortgages and later high yield debt). They took on substantial interest rate risk and many S&L’s did not hedge or otherwise manage that risk; earning the premium for taking the risk of maturity intermediation was an integral part of their business model. After the S&L crisis there were effectively no financial institutions of any importance left in the US economy that did not adopt sophisticated interest rate risk management processes.
One of the interesting consequences of improved interest rate risk management in the financial sector is that the profitability of financial institutions would be less impacted by changes in interest rate policy. That is, small changes in Fed interest rate policy would no longer impact financial sector profitability.
With interest-rate risk more effectively managed, the big risk left on the books of financial institutions is credit risk—the risk of a recession that substantially diminishes the credit quality of their loan portfolio. Even in the credit risk sector, financial institutions vastly improved their ability to assess and manage credit risk over the decades—not enough to handle a deep recession such as 2008-2009, but effective credit risk management does limit the ability of the Fed to tap the brakes or hit the accelerator to influence the real economic growth.
Make no mistake, if the Fed were to raise short-term interests sharply above the prevailing rate of inflation, they could no doubt trigger a recession, but macro-economic management and fine-tuning has become less and less possible. This latter point illustrates some of the asymmetry in Fed policy outcomes. The Fed can still cause a recession by tightening too much—often measured by the shape of the yield curve. When short-term rates are equal to long-term bond yields (flat yield curve) or when short-term rates are set above long-term bond yields (inverted yield curve), recessions often follow in one or two years. The other side does not work so well anymore. Near-zero rates and asset purchases can raise equity and bond prices above what they otherwise would have been, but the impact on the real economy and inflation is virtually non-existent. Put another way, the Fed can still create asset price inflation as it did in the 2010-2016 period of emergency low rates and QE, but the Fed has very limited ability to encourage more growth in an economy already creating jobs at a good pace.
One last caveat is in order: When an economic recession is caused by a financial market failure such as 2008-2009, central bank buying of assets (i.e., the Fed’s approach) or provision of emergency liquidity loans (i.e., the European Central Bank’s approach) can limit the damage of the recession and prevent a downward spiral into a depression. This ability to contain a recession, however, does not translate into an ability to promote additional economic growth when an economy is already growing again.
If not monetary policy, what about fiscal policy?
With monetary policy having failed to produce the additional economic growth and inflation pressure desired by policy makers, the US is embarking on a rather grand experiment in 2018 to see if large permanent corporate tax cuts can encourage economic growth and possibly push inflation a little higher. The outcome will be interesting to observe and is not so clear because the link between tax cuts and spending is quite loose. Corporations may choose to buy back shares, pay larger dividends, refinance debt or make acquisitions—all of which have excellent potential to increase shareholder value and yet may have no impact on the real economy. Only if corporations use the tax cut to pay higher wages or to invest in expansion plans in the US will the domestic real economy see higher spending. Some of this may, indeed, happen. The big question is how much and will it be enough to make a material difference in the growth of the economy. If one assumes tax cuts unambiguously increase spending on goods and services, then higher real growth and inflation pressure follow from the assumption of higher spending demand. If one assumes the permanent tax cuts to corporations and the temporary rate cuts for relatively well-off individuals will not raise spending demand by very much, then of course the impact on growth and inflation will also be small.
While not on the current policy agenda, this analysis also suggests increases in government spending is a more direct way to stimulate spending demand. After all, gross domestic product is the arithmetic sum of consumption, investment and government expenditures, plus net exports. Raising government spending goes directly toward increasing spending demand in the domestic economy without any confusion or debate as there is with corporate tax cuts. Indeed, the restraint in the growth of US federal government spending during the 2010-2017 period—after the one-time emergency fiscal spending of 2009—is arguably one of the reasons inflation remained subdued even with near-zero short-term interest rates.
Another fiscal policy issue for analysis is the rise of the national debt. At least in the short-term, both tax cuts and increased government spending would work to increase the deficit. Only if materially higher economic growth appeared down the road would tax revenues rise to partly offset the tax rate cuts or the increases in government expenditures. We carefully note, though, that rising debt loads do not signal future recessions. Over the long term, growing economies typically take on more debt relative to GDP. As the debt to GDP ratio grows, though, the economy becomes more fragile and more interest rate sensitive. That is, higher interest rates mean higher interest expense, so rising national debt raises the risk of a monetary policy mistake—moving too fast to a flat or inverted yield curve—and causing a recession. Our conclusion is higher debt loads may well translate into a more cautious Fed in terms of raising short-term interest rates.
And, why haven’t tight labor markets resulted in rising inflation?
Moving on to the labor market theories of inflation, the assumption labor economists such as Janet Yellen typically make is that low unemployment rates are indicative of tight labor markets. This means stiff competition for scarce labor and thus leads to higher hourly wages, which signals increased spending demand. There is, indeed, a loose contemporaneous correlation between wage inflation and consumer price inflation, but that relationship is not necessary causal—just an empirical association. And, as labor markets have shifted over the decades to more and more service sector jobs and less and less manufacturing jobs, the case for a causal relationship running from hourly wages to inflation has been weakened, if not destroyed.
To focus on spending demand, our preference is to look at the growth in total labor income. Total labor income growth is the sum of employment growth (more people working), growth in hourly hours worked (people working longer) and growth in hourly wages (people getting paid more). If you look at any one of these items in isolation, you risk getting the wrong answer. In Janet Yellen’s defense, she definitely preferred a holistic approach to labor market data—looking at every measure possible to assess in a qualitative way what is really happening.
The focus many analysts put on hourly wage growth, though, is misguided. The problem is—yes, you guessed it—in the assumptions. The link between hourly wage growth and total labor income has a lot to do with what kinds of jobs are being created. Most models created by economists make the assumption that the job distribution within the economy is stable. Nothing, of course, could be more wrong in this era of corporate disruption. The economy is creating many more lowly paid service jobs and losing relatively better paid manufacturing jobs. This is a multi-decade trend, so why so many academic and policy-oriented economists do not give it more emphasis in their inflation forecasting models is a mystery to practitioner economists. The only relatively highly paid sector seeing job growth is business professionals, including those in finance, accounting, insurance and legal professions. This sector is too small to move the inflation needle. The basic point is if the job mix is shifting to relatively lower paid professions, the overall average hourly wage growth will be biased downward regardless of the path of consumer price inflation.
There is more to this story, too. Spending demand is a function of both ability and willingness to spend. The growth in total labor income measures the changes in the ability to spend, but it does not necessarily reflect the willingness to spend. Our view is that fear of losing one’s jobs is the primary factor affecting willingness to spend.
After the 2008-2009 Great Recession, many companies shed jobs. If you kept your job, you may have witnessed family, friends or co-workers lose their jobs. This is the province of behavioral finance and psychology, but we would argue the recovery from a recession involves much more than job creation—the fear that swept through the labor force from job losses in the recession may take much longer to diminish. Hence, spending demand undershoots a linear extrapolation of total labor income growth until the job-loss fears abate. And, in this era of corporate disruptions, fears of losing one’s job have not abated very quickly. For example, brick and mortar retailing is being disrupted and goods delivery jobs are being created. Overall, job growth is doing fine—unless you are in one of the disrupted sectors, and then fear of job loss remains. This means in the long-lasting yet modest economic expansion after the Great Recession of 2008-2009, spending demand was held back by the very slow recovery in confidence in maintaining one’s job and income. The fear declines each year of the expansion, but it is a slow process in this era of disruption.
Outlook and Risks for 2018
Our initial conclusion regarding the 2018 US inflation and growth outlook is to give little credence to traditional, simplified forecasting approaches. The heroic assumptions that once made these simple models useful have long since been relegated to the dustbin. Like it or not, the analysis is nuanced and complex.
When considering all the various factors, our view is the glass is more than half full and spending demand appears to be incrementally on the rise in 2018. There are two critical factors:
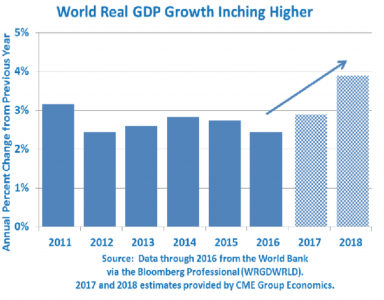
First, global growth is rising. Improved global growth tends to lift all boats, although not always by the same amount. The increases worldwide in growth are coming in no small part from improved conditions in commodity producing countries such as Russia and recoveries in some countries such as Brazil that suffered a deep politically-induced recession. Real GDP growth is also inching higher in Europe and Japan. As global real GDP growth heads toward a 4% annual rate, this provides an excellent backdrop for incremental improvements in the US economy as well.
Second, fear of losing one’s job is diminishing each year. Job growth has been very steady since the economic expansion began in late 2009. While, as already noted, job growth is being led in lower paid service professions, there is still plenty of job growth to go around in other sectors, too, to make workers feel much more confident in their future.
There is also the new tax law—mainly a permanent corporate tax cut—with some temporary reductions in personal tax rates along with removal of some deductions. All in all, the effect of the new tax law will take several years to have its full impact. The consequences for spending demand in 2018 are not likely to be large, since most of the corporate tax cuts will initially feed into higher share prices driven by stock buybacks, higher dividends, debt restructuring and mergers and acquisitions. Still, the short-term impact of the new tax law is likely to be positive for the economy, although very hard to untangle from the following wind from improved global growth and the diminished fears of job losses leading to strong consumer confidence.
Our baseline scenario is that US core inflation, excluding food and energy, will gradually see more upward pressure in 2018 and rise toward 2.25% to 2.5% year-on-year by December 2018. This pushes core inflation into the upper half of its multi-decade range of 1% to 3%, but it decidedly does not constitute a breakout toward 4% or 5% inflation down the road.
Our baseline economic growth projection is also around 2.5% for US real GDP. This is a decided improvement over the 2% average from 2010 through 2017, but it is incremental—not a major shift to +3% real GDP growth. While not discussed in this report, the biggest constraining factors for the US economy come from demographics and economic policy. First, there is the slow growth of the labor force. The arithmetic is that real GDP growth is the sum of labor force growth and labor productivity growth. Demographics have slowed labor force growth and labor productivity has not picked up the slack. Second, there is the exceedingly large baby boomers generation moving into retirement (less spending demand) while the not quite-so-large millennial generation enters the workforce, especially encumbered by heavy student loan debt which constrains spending demand.
Another risk to the forecast is future developments in trade policy. The US is involved in negotiations with Canada and Mexico regarding the North American Free Trade Agreement (NAFTA), and the negotiators are at an impasse. The US (or Canada or Mexico) can unilaterally withdraw with six months’ notice. A considerable number of sectors of the US economy would be disrupted by such a decision, including corn, natural gas and beef cattle (all exports from the US to Mexico), as well as the multi-country integration of the automobile industry, which may have a tough year anyway as US car sales are expected to slow. If the US chose the unilateral withdrawal approach, equity markets would probably decline and be a signal of how significant the demise of NAFTA would be for the economies of the US, Canada and Mexico. The US is also in trade talks to revise the treaty with Korea, and the US withdrew from the Trans-Pacific Trade Agreement. Trade is a key driver of global growth. The Great Depression was made worse by the imposition of heavy tariffs with the Smoot-Hawley legislation. So far, though, the trade talks have been a benign factor in the outlook.
In summary, with low unemployment and rising inflation expectations, the Fed is on track for two or three rate increases in 2018, but the pace of the rate increases will depend on the actual path of inflation—not the expectations. Also, with the new tax legislation expected to increase budget deficits and the national debt in the short-run, the Fed is likely to tread very carefully and move slowly regarding any rate increases. Finally, the Fed does not want to be blamed for causing a recession, and the best historical indicator of a future recession has been when the yield curve moves to a flat shape with short-term rates roughly equal to long-term bond yields. As the yield curve flattens, the Fed will debate the value of this indicator, but the Fed will stay cautious just in case the yield curve recession indicator still works.
Bluford “Blu” Putnam has served as Managing Director and Chief Economist of CME Group since May 2011. With more than 35 years of experience in the financial services industry and concentrations in central banking, investment research and portfolio management, Blu serves as CME Group’s spokesperson on global economic conditions.
You can also view a 2015 interview with Blu Putnam and Joe Guinan, CEO of Advantage Futures, here.