


February 2016
Commodity and equity markets are seeing nearly a perfect storm of bearish factors at the start of 2016. In the order of importance, plummeting oil prices top the list followed by stuttering growth in China, fears of a strong dollar and expectations of as many as five interest rate hikes. While these factors represent classic deflationary conditions, bearish confidence and aggressive speculative and hedge selling have brought the price declines to a fever pitch. One could suggest that economic expectations were being pulled downward to reflect almost no forward progression. In the first week of January 2016 alone, several economists were talking about a return to recession.
Treasury Markets
A consistent lack of alternative investments had left Treasuries in vogue since the late-2013 lows. However, a significant change took place after the March 2015 highs. The bull track lost momentum as the market showed a consistent pattern of lower highs and lower lows. The Treasury markets had previously forged a peak in mid-2012 as the hope of a self-sustaining recovery waned in the wake of a series of international events like the Greek debt crisis. The slide in Treasuries then halted oft-renewed fears of a breakup of the Euro zone and a subsequent slide in commodity prices.
Beginning of another Top?
The US rate hike that the Fed initiated in late 2015 was seen by many Treasury traders as a fresh headwind for the US economy and that, combined with another crisis of confidence regarding China’s economy, sparked the most concentrated dose of bearish commodity and equity market sentiment since the sub-prime crisis. By January, some analysts were advising investors to “sell everything.” A number of brokerage firms were targeting a slide in crude oil prices down to single digits.
The limited gains in US Treasuries in the face of the January deflationary spiral was disappointing for the bond bulls. With US non-farm payrolls posting a series of monthly gains and the magnitude of those gains starting to get more attention, we think the US economy will achieve enough momentum to drag the rest of the world toward growth. In the basic building blocks of the economy, extremely low commodity prices can act as stimulus. A bulldogging recovery in the US might be just the fix the world needs to claw its way toward growth and away from stagnation.
As of early January some may think it folly to predict anything more than anemic global growth, but we think Treasuries will find it increasingly difficult to sustain above 157-00, perhaps even above 155-00, in the nearby contract. In the event the US maintains its forward motion and the European economy starts to turn more upbeat, China’s export outlook should also improve and China Inc. might move away from its current “crisis” levels. Therefore, the most optimistic targeting in nearby Bonds might be down at 148-00, with similar downside targeting in nearby Notes at 124-00. There are reasons why some Fed members see 4 or 5 rate hikes in 2016!
Energy Markets
Crude Oil
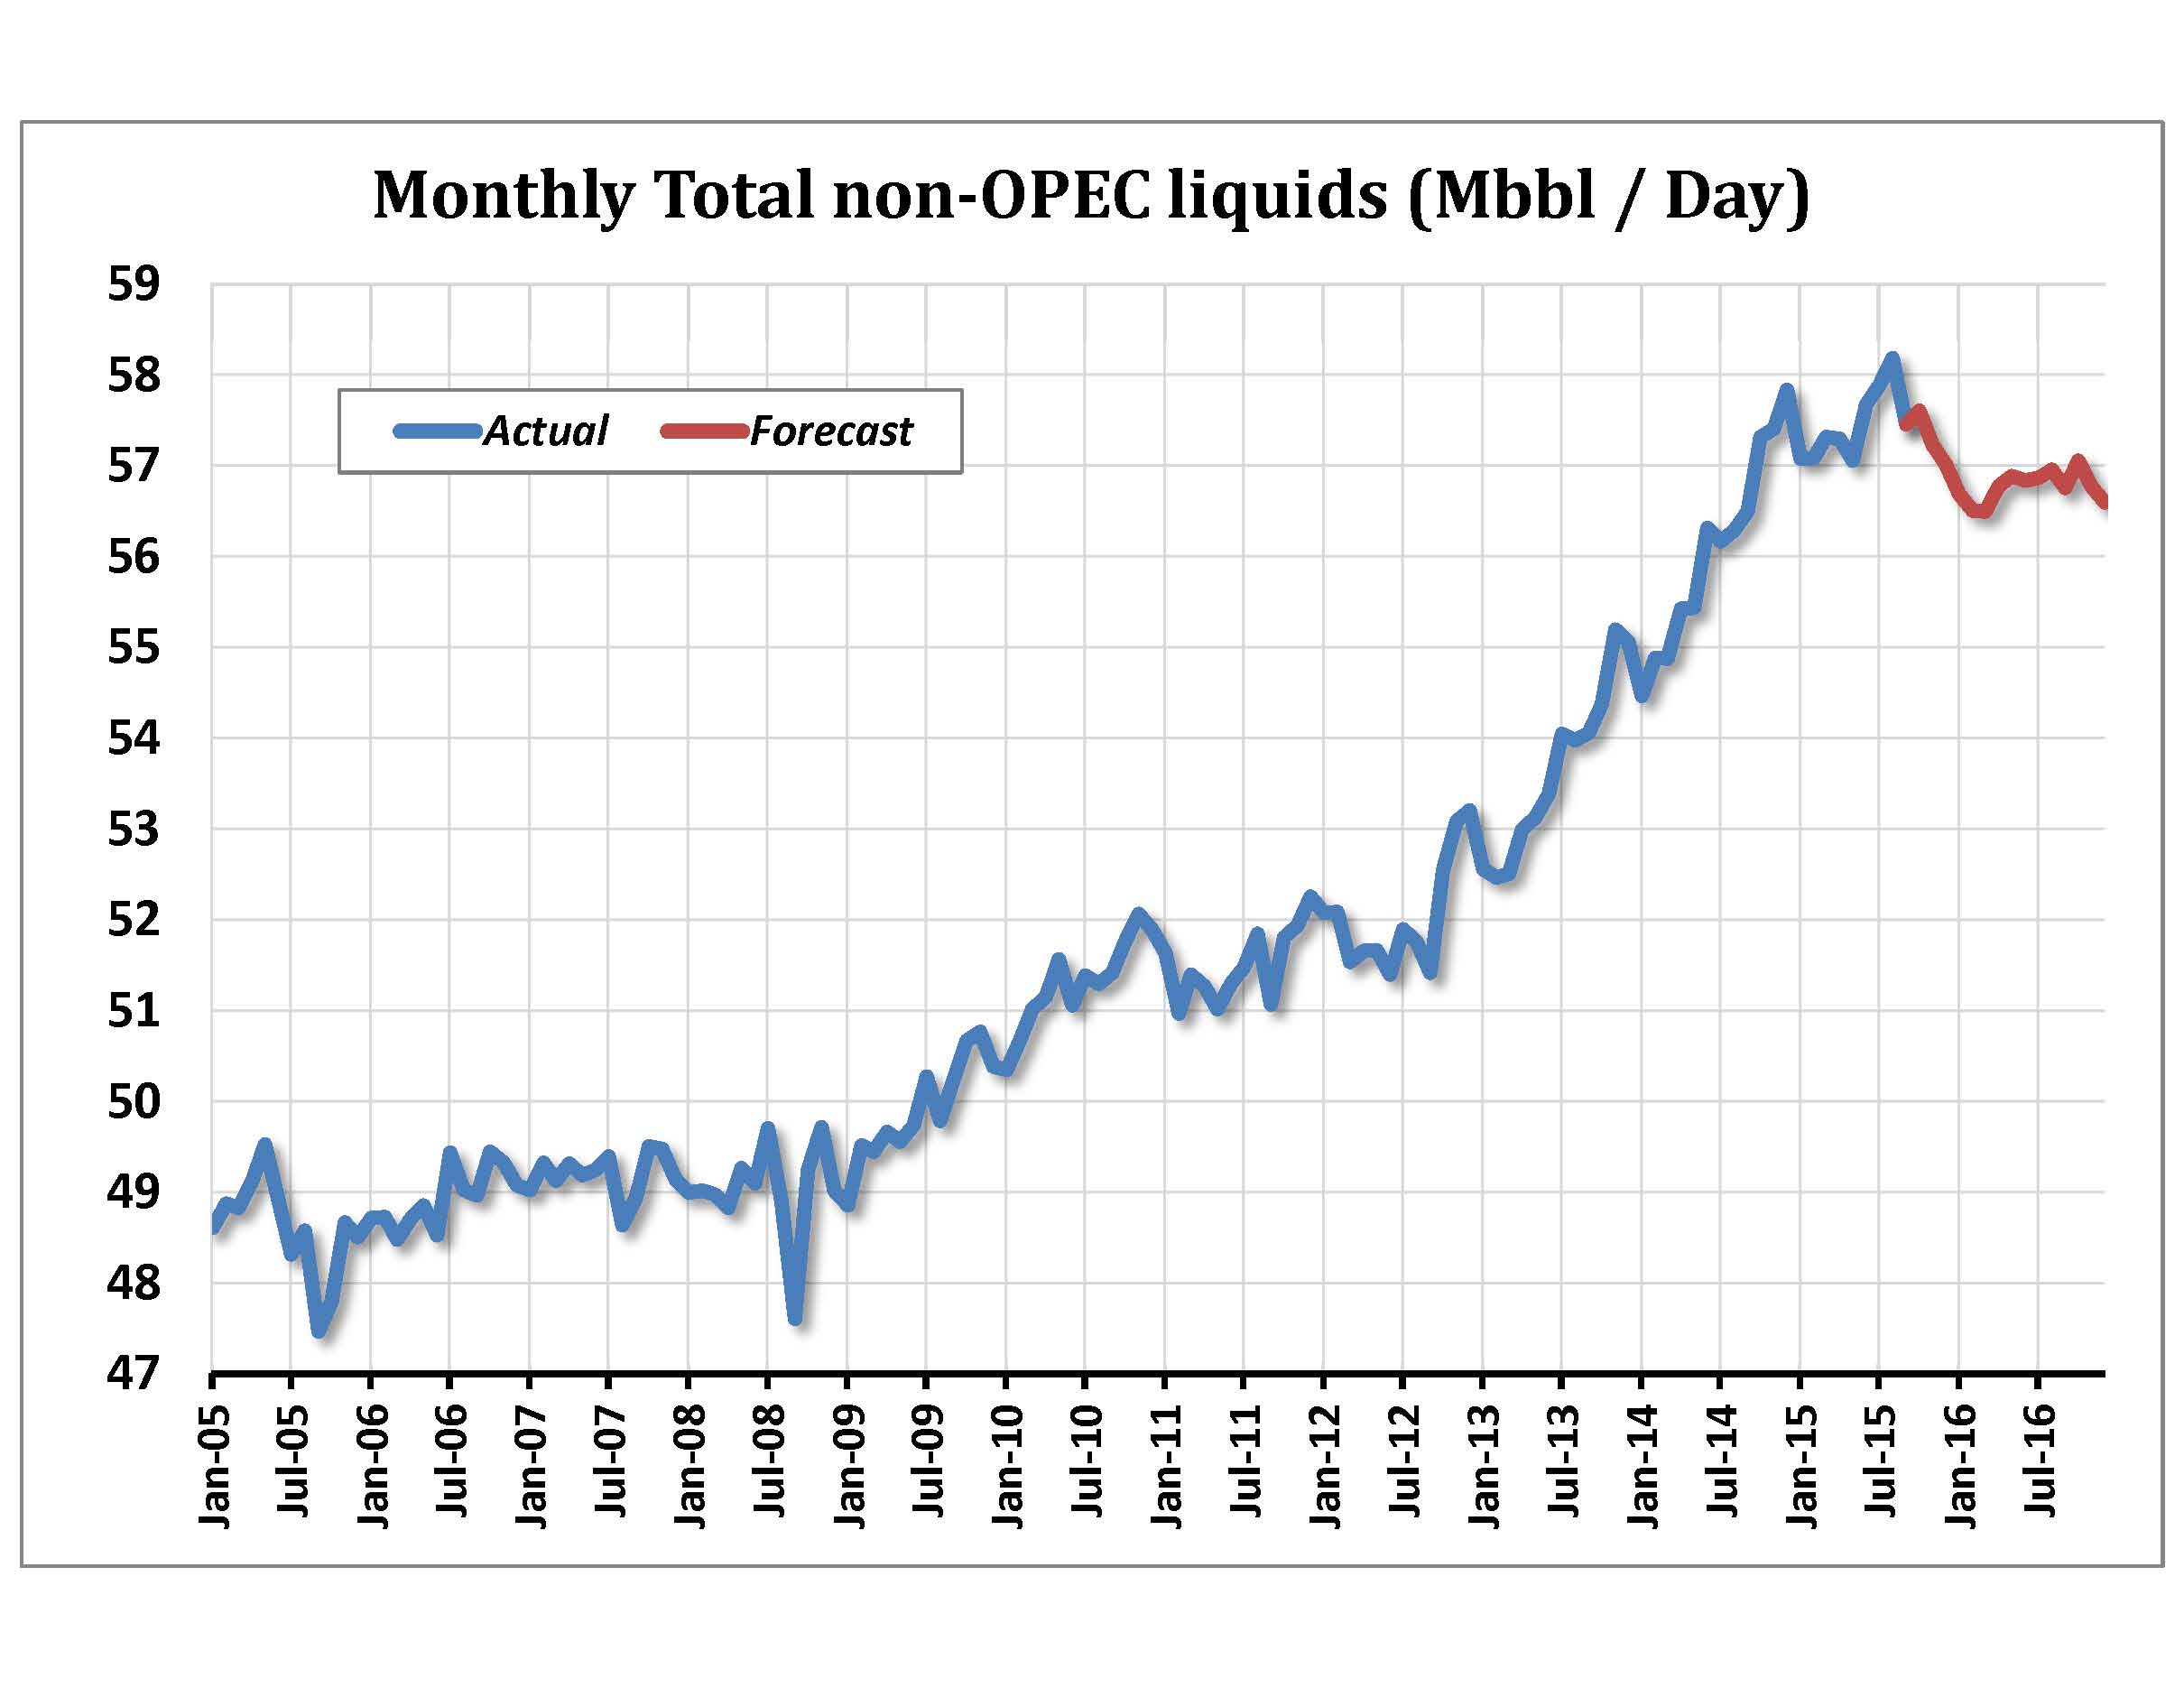
WTI Crude Oil is in the process of working off the excesses from shale oil production and a downshift in global economic growth. Key on the list of headwinds facing the market are increasing global oil supplies and slowing global economic growth. Major OPEC producers are maintaining an active production pace to preserve market share and exert greater pressure on US producers. This plan appears to be working, as nearby WTI crude oil prices have fallen below the 2008 financial crisis lows and oil investment has contracted by 20%. Non-OPEC production is expected to decline by 970,000 barrels per day in 2016.
At their December 2015 meeting, OPEC effectively ended their 30.0 million-barrel-per-day output ceiling, with a renewed focus on guarding market share and little impetus to trim production. OPEC production was estimated at 32.6 million barrels per day as of late 2015. A report by the International Energy Agency (IEA) forecasted the oil market to remain oversupplied into the fourth quarter of 2016. This is likely to prolong the bottoming process for the market for much of the year.
The addition of Iranian production is an added concern for crude oil bulls now that sanctions are being lifted in the wake of the nuclear agreement. Iran’s energy ministry had stated they expect oil exports to ratchet up 500,000 barrels-per-day in the days following a lift in sanctions, with another 500,000 barrel-per-day gain six months later. However, there have been other reports that Iran is struggling to bring operations back on line and that exports would reach only 100,000 barrels-per-day within the first month and an additional 400,000 barrels per day six months later.
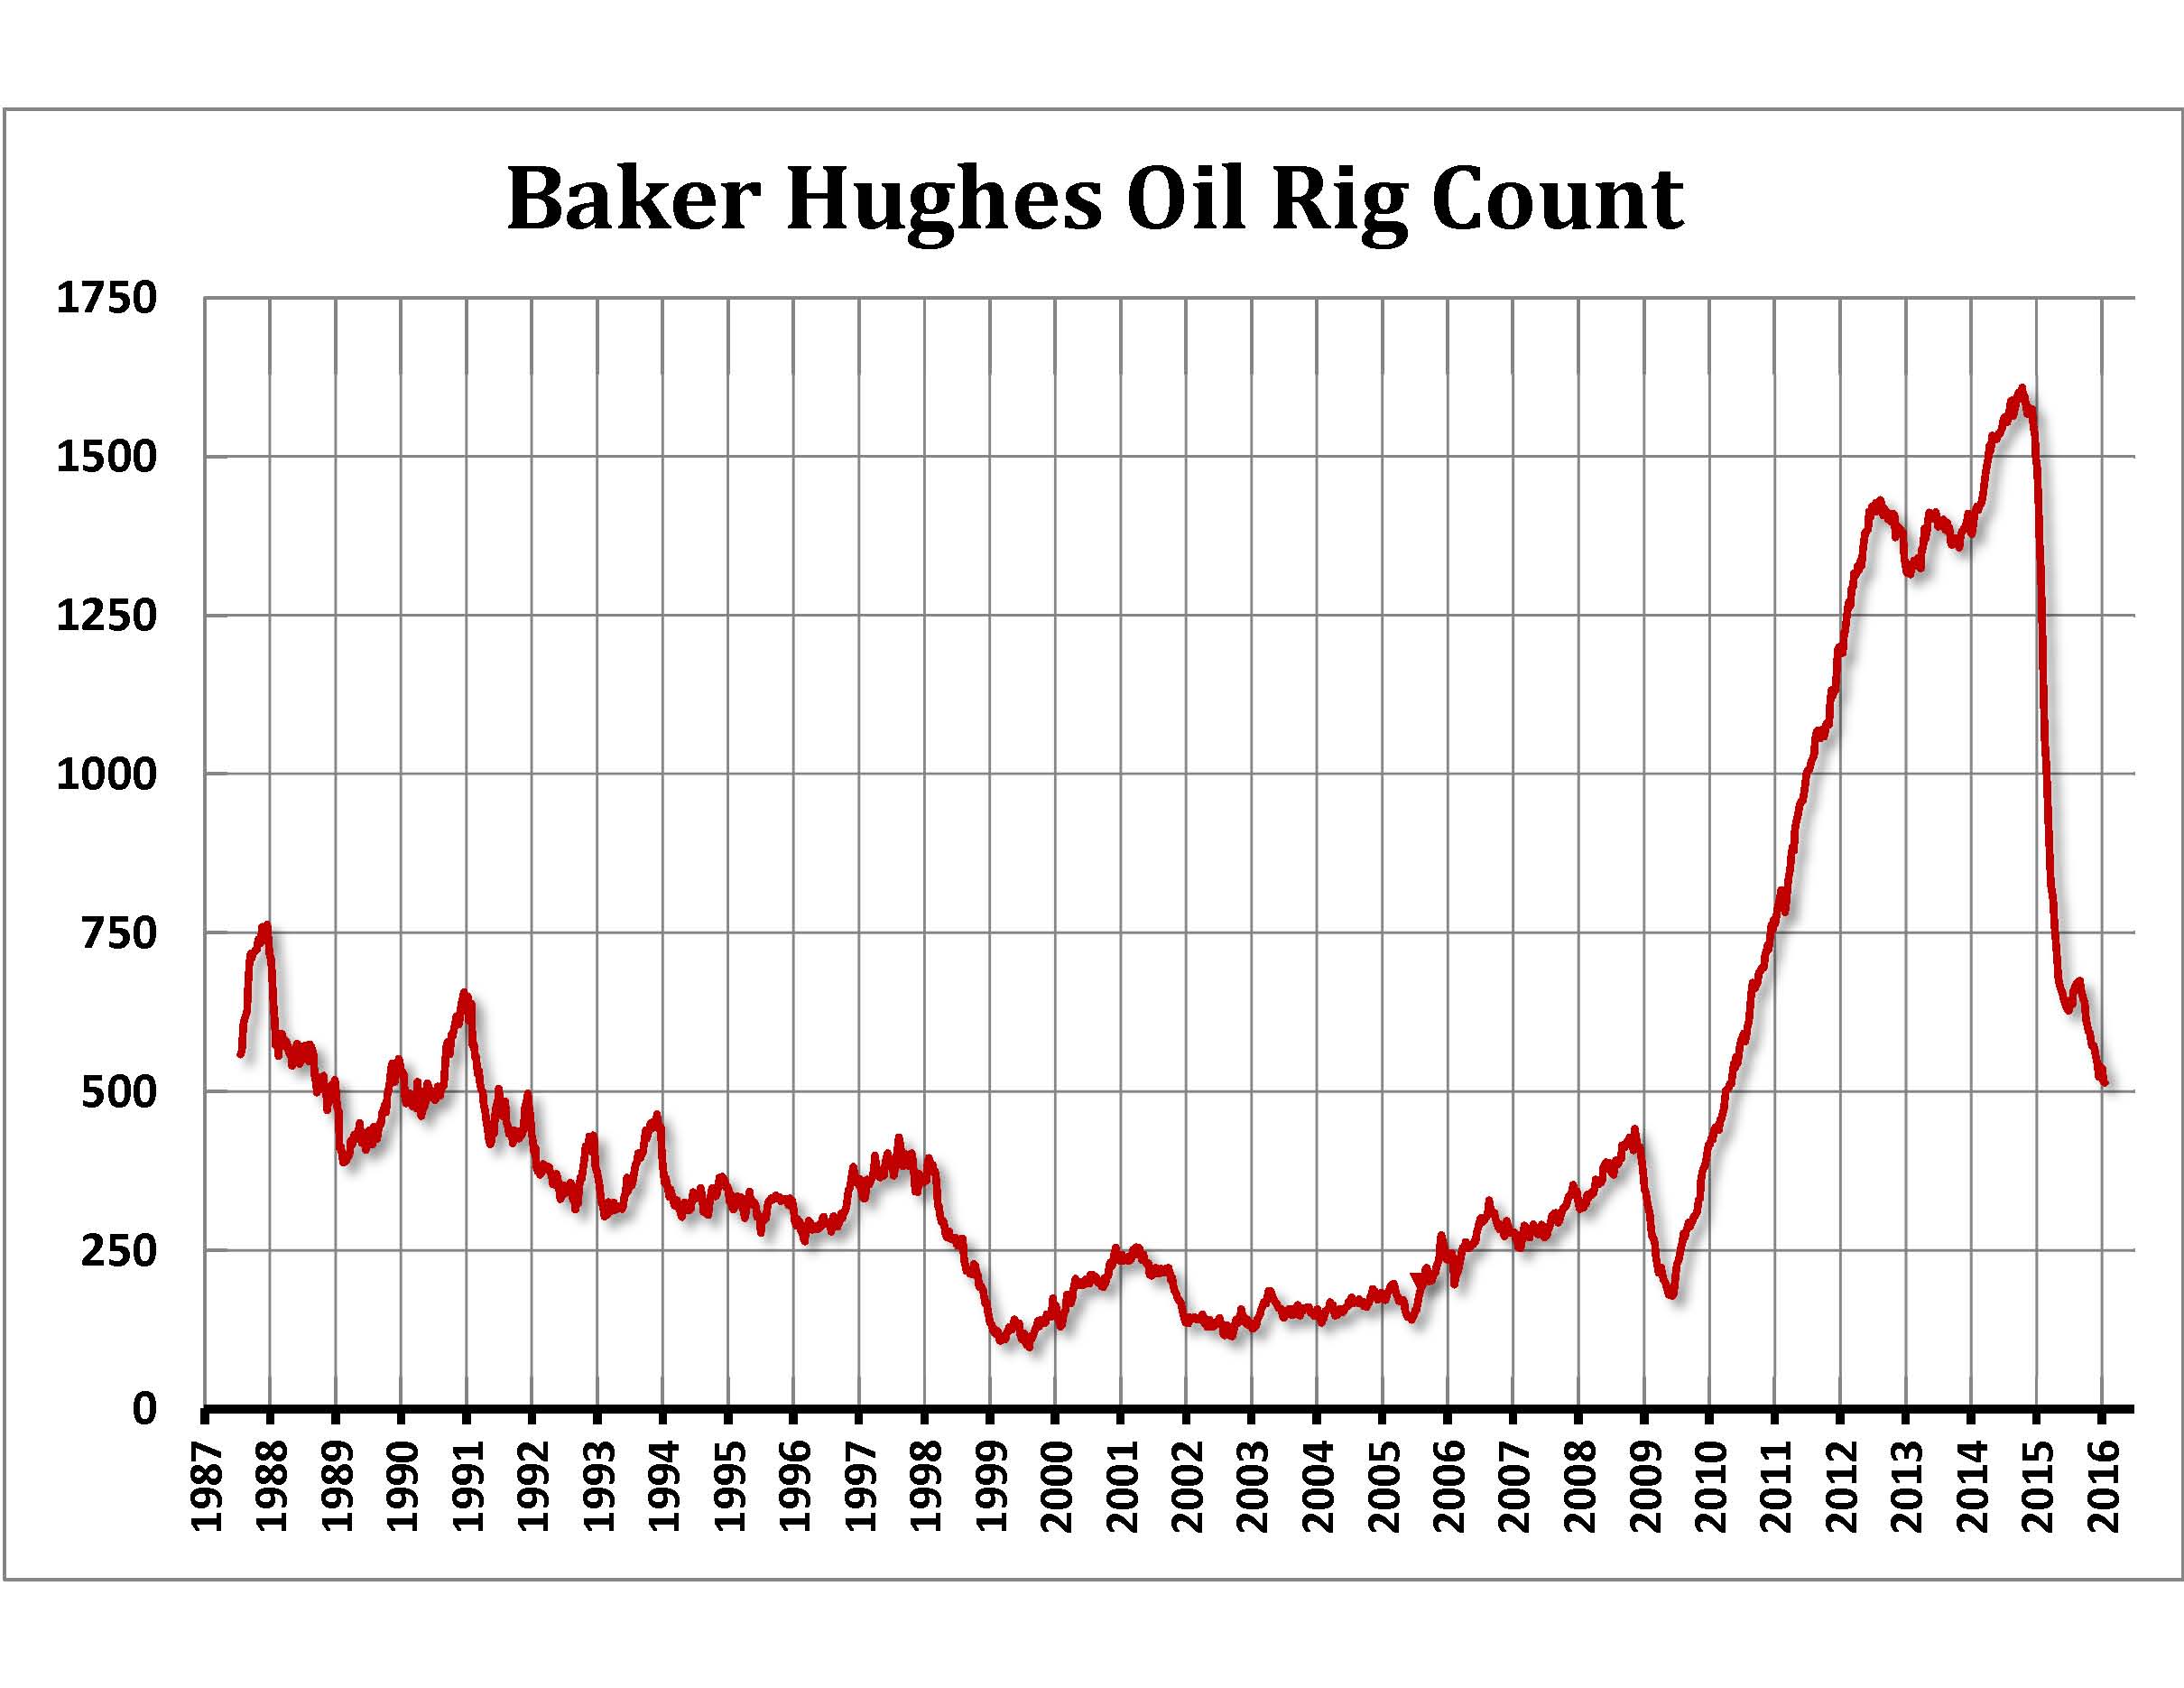
US crude oil production has pulled back from a record-high 9.6 million barrels per day in April 2015, and the US Energy Information Agency (EIA) is forecasting US production to continue to decline in 2016 to an average of 8.73 million barrels per day. This figure could go lower as US shale oil producers face tighter credit conditions, legacy hedges expire, and fears that prices may stay much lower for much longer deepen. The weekly Baker Hughes US crude oil drilling rig count fell to 515 in early 2016 — a 5-year low. So far, US shale oil production declines have been relatively minor, but they could be prone to steeper declines as oil well efficiency diminishes with the passage of time.
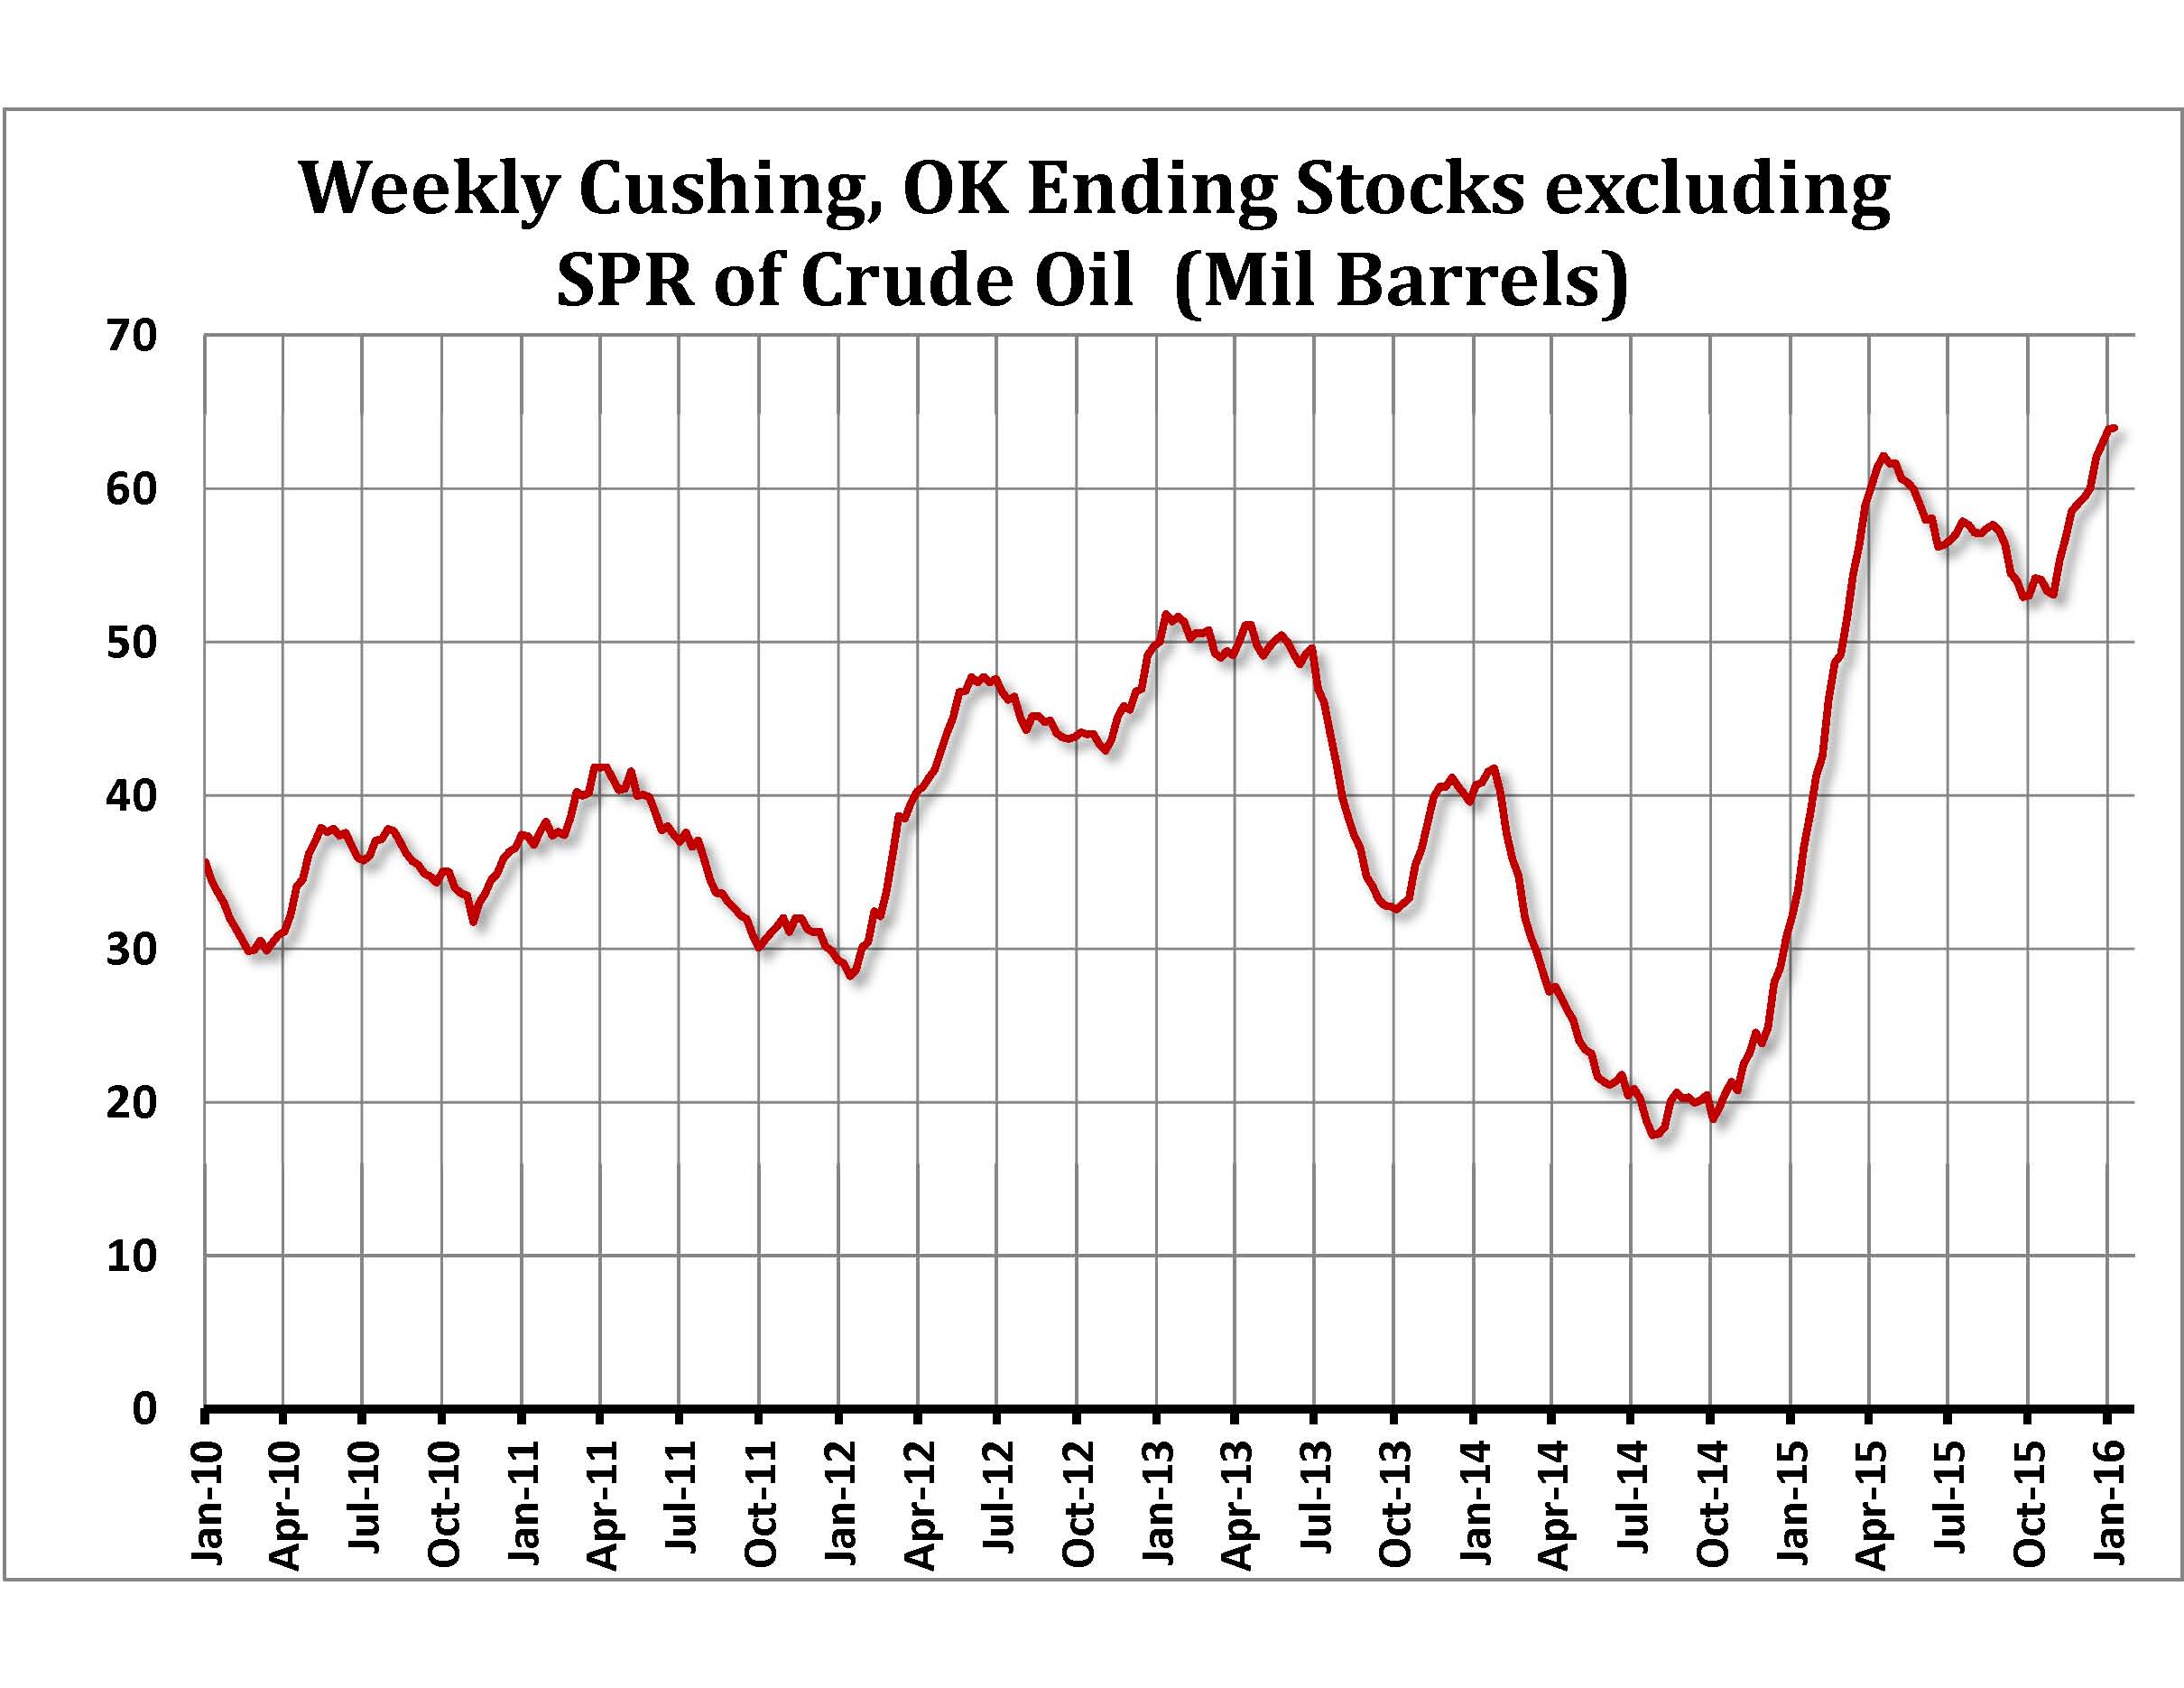
Crude oil inventories held in Cushing, Oklahoma, have reached 64 million barrels — within 10 million barrels of maximum working capacity. In the first week of 2016, total US crude oil inventories reached 482 million barrels — 128 million barrels above the 5-year average.
A further contraction in US crude oil drilling activity, as well as a pullback in US crude oil production below 8.7 million barrels per day, would aid in bringing a bottom in WTI closer to reality. Other supportive factors would be an uptick in global auto sales trends, business surveys and other macroeconomic statistics.
RBOB Gasoline
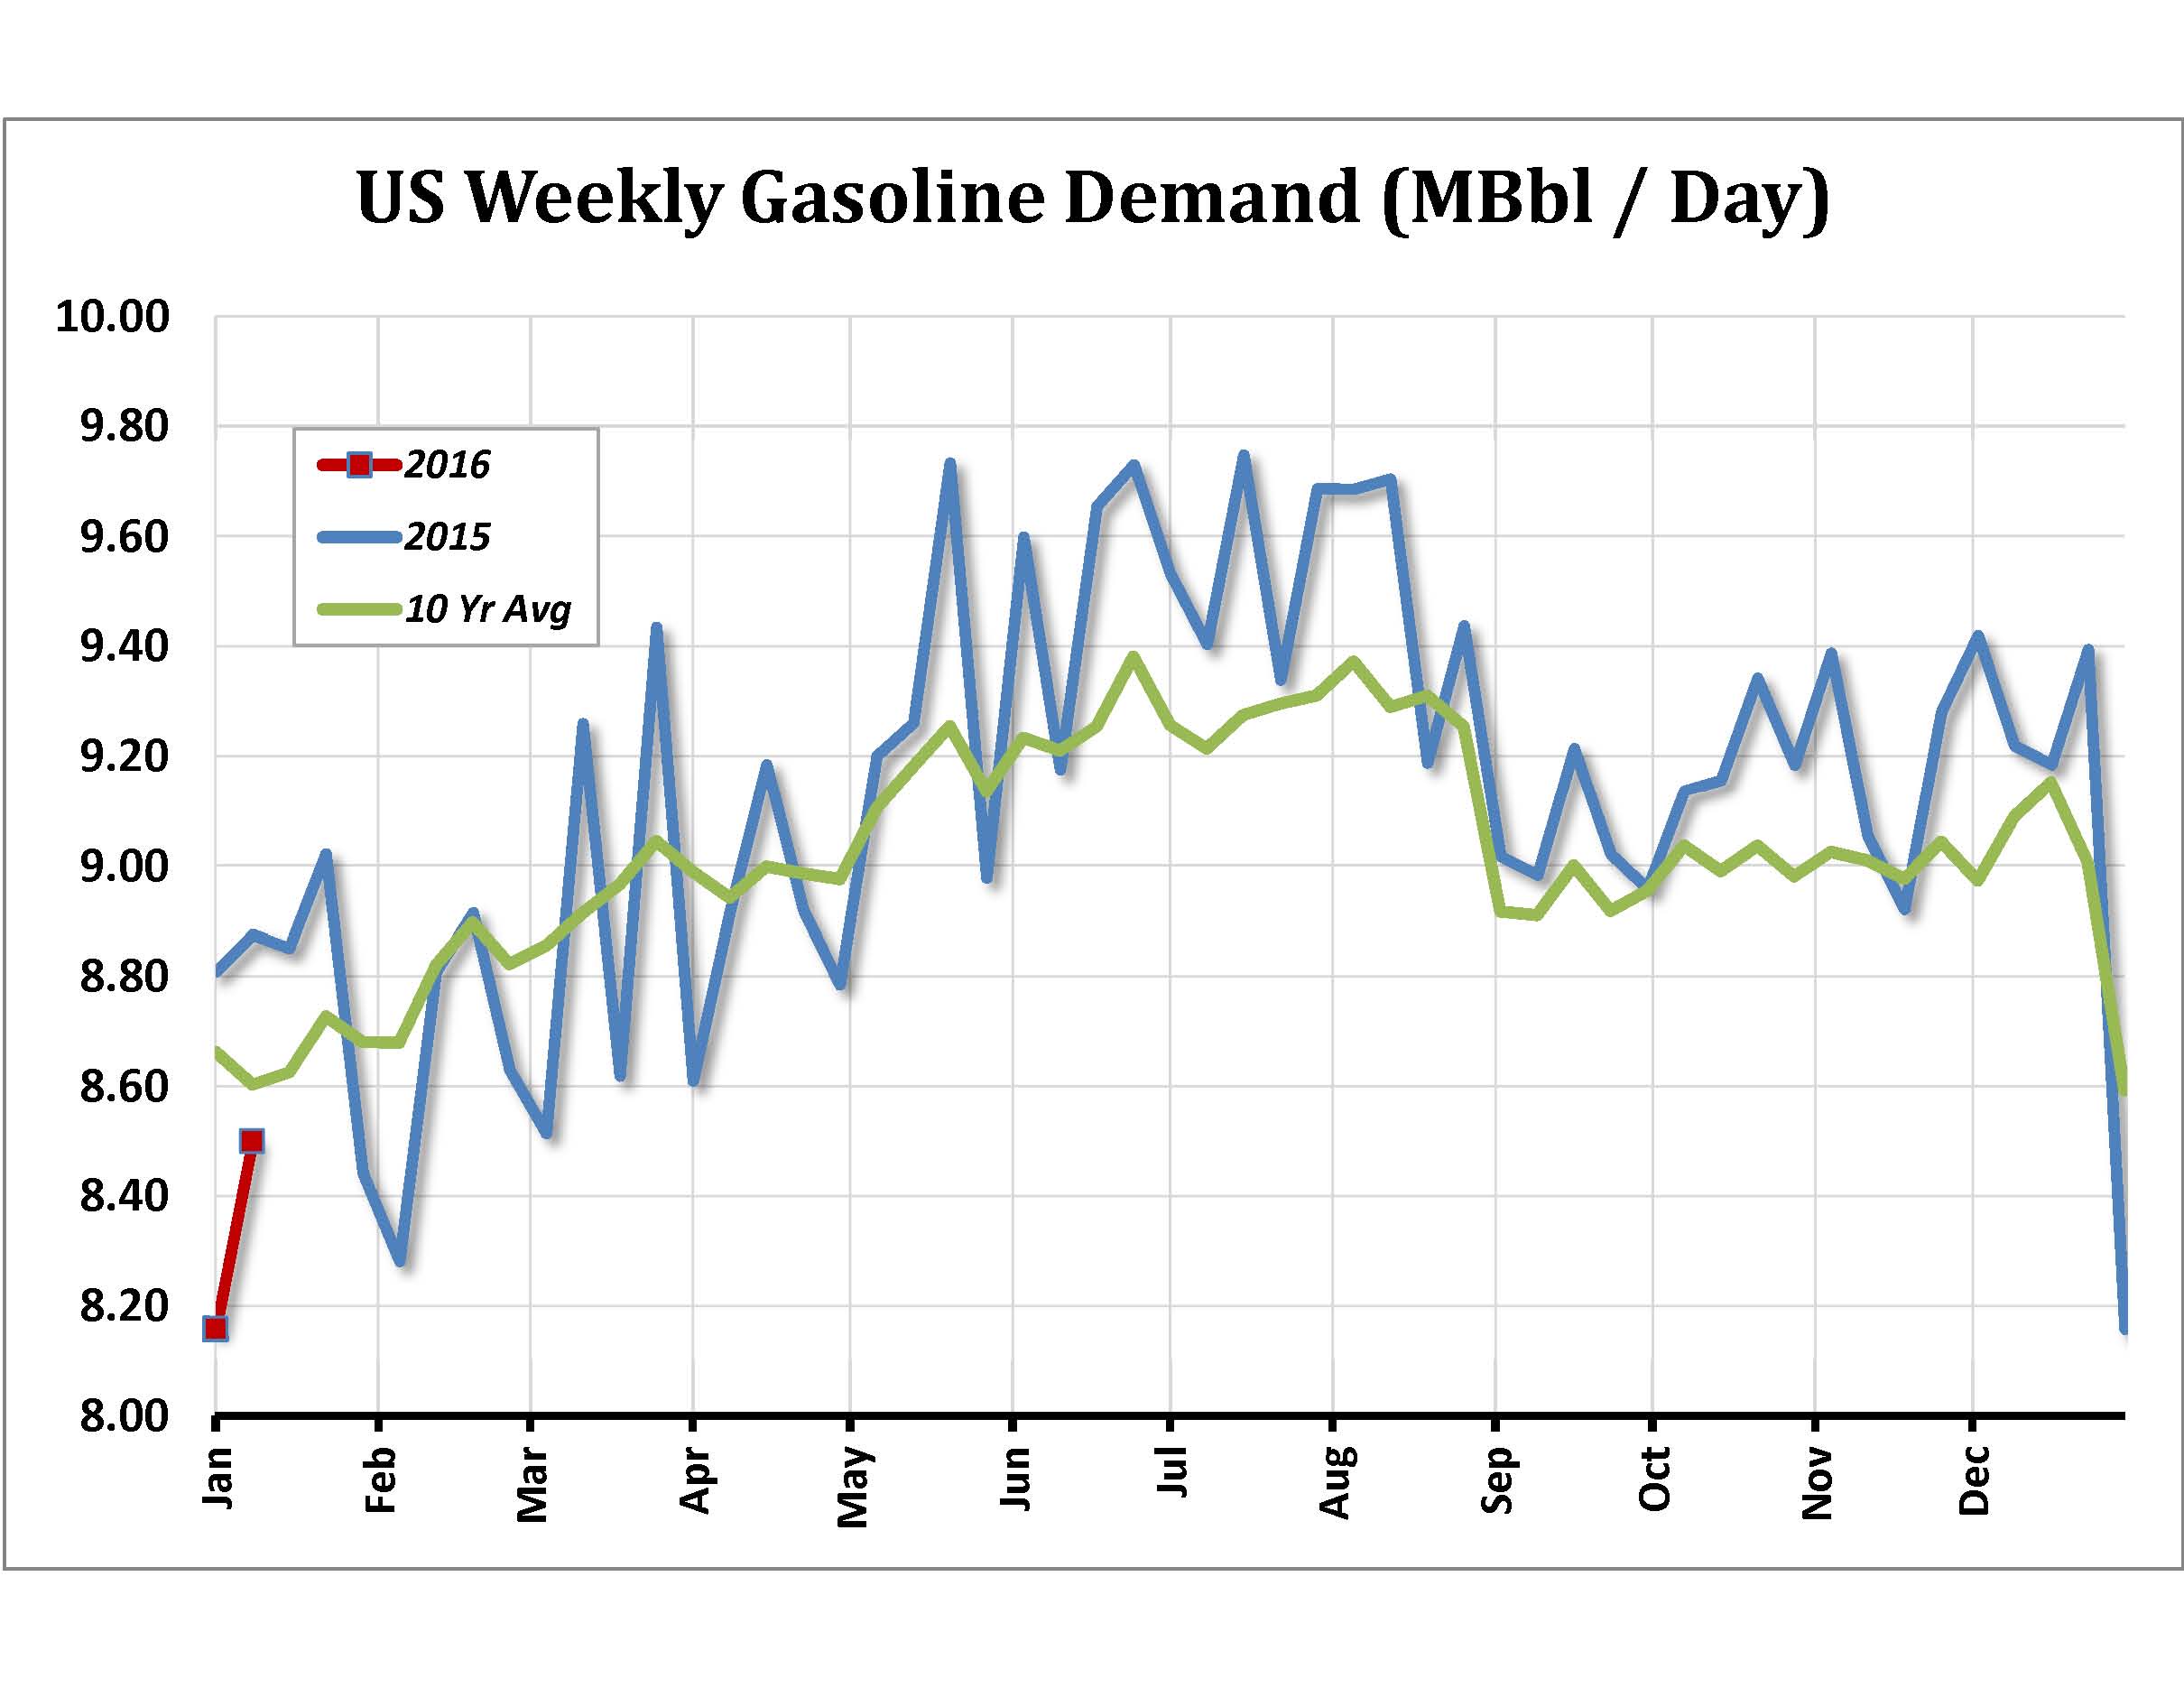
Gasoline demand has been robust in the face of weak economic conditions, fed by strong global auto sales and increased usage by China as it transitions to a more domestic consumption-oriented economy. China’s gasoline demand was up 10.4% during the first ten months of 2015 compared to the same period in 2014. The EIA is estimating that US vehicle miles traveled for 2015 are up 3.3% from 2014, with a record 9.169 billion miles/day registered in June. They have forecast further gains of 1% in 2016 and another record-high level during the summer. US implied gasoline demand increased toward 8-year highs in 2015 and came within striking distance of the 2007 record-high of 9.762 million barrels per day during the summer months. As of December 2015, the EIA was estimating average US implied gasoline demand for the year at 9.14 million barrels per day, up 2.5% from 2014. However, US gasoline supplies increased in 2015 despite increased demand. Advantageous refining margins because of cheaper crude stocks kept production strong.
The bearish price trend for RBOB Gasoline remains in place to start 2016, but severely oversold technical conditions and relatively solid demand prospects for the 2016 summer period could bring about a bottom in the market during the second quarter. A drive back above $1.2650 in the nearby price could inspire a rally back toward the $2.00 area, perhaps this summer.
ULSD/Heating Oil
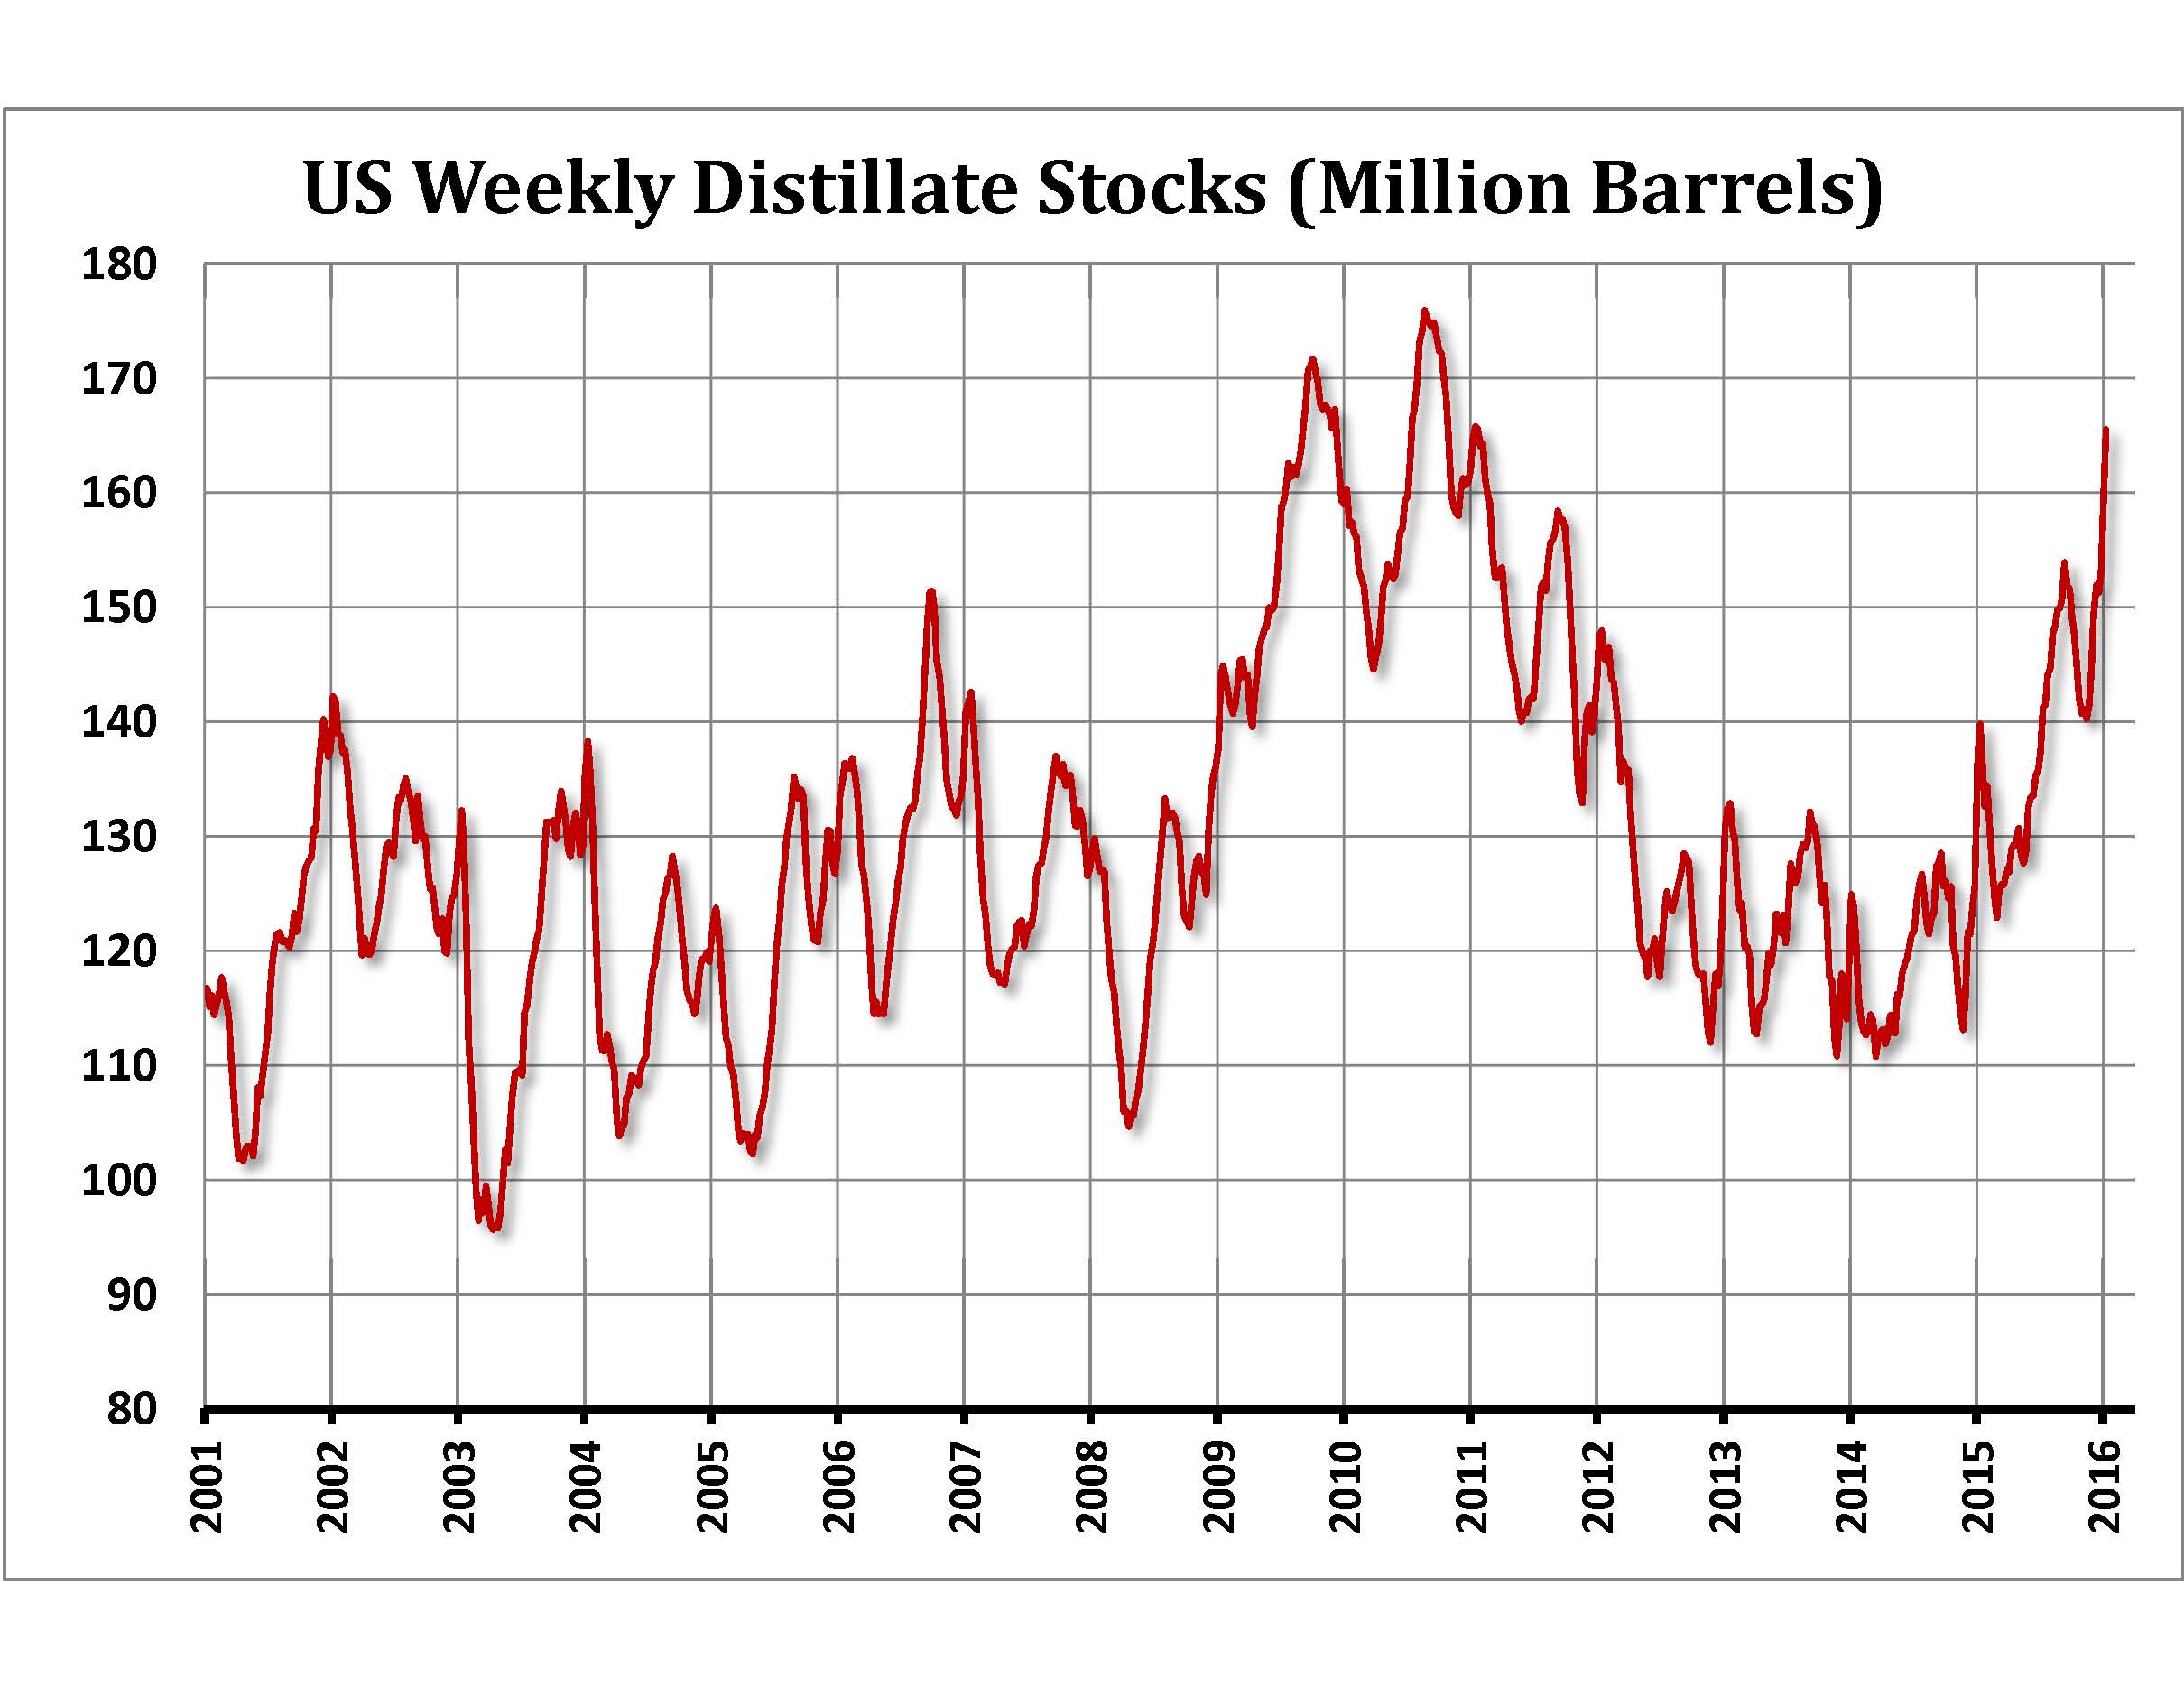
Ultra-Low Sulfur Diesel prices have maintained their bearish trend into the start of 2016, and they are expected to continue on that course in the face of abundant distillate supplies and soft demand. At 165.55 million barrels, US distillate inventories are at their highest level since early 2011. European diesel supply was up 12% from year ago levels in late 2015, and European gasoil inventories were reaching capacity levels, with some large producers seeking floating storage for additional supplies.
The National Oceanic and Atmospheric Administration (NOAA) forecasts a mild winter for 2015/16 across the US, and the EIA is projecting a 13% decline in heating oil consumption. As a result, 2015/16 US heating oil expenditures are expected to be down 31% from the last year to their lowest in nine years.
The ULSD market has already experienced a steep decline, falling 63% from its February 2015 high of $2.3514 to its January 2016 low of $0.8588. This has resulted in a severely oversold technical condition for the market. With the nearby ULSD prices at the start of 2016 sitting at their lowest level since July 2004, it appears mild winter conditions have already been priced into the market. If the winter of 2015/16 turns out less mild, the market could be set for some short-covering rallies.
The price trend in the heating oil market is negative to start 2016, but an oversold technical condition and net short speculator positioning leave the market vulnerable to sharp short-covering rallies during the first half of the year. However, it will probably take an improvement in emerging market and US demand and a setback in distillate inventories in order for the market to put in a multi-year low.
Natural Gas
An uneventful Atlantic hurricane season and prospects for above-normal winter temperatures in the US appear to be leaving the bear camp in control of the natural gas market at the start of 2016. NOAA is forecasting a mild winter this year, and the EIA is predicting total US heating degree days will be down 2.7% from 2015.
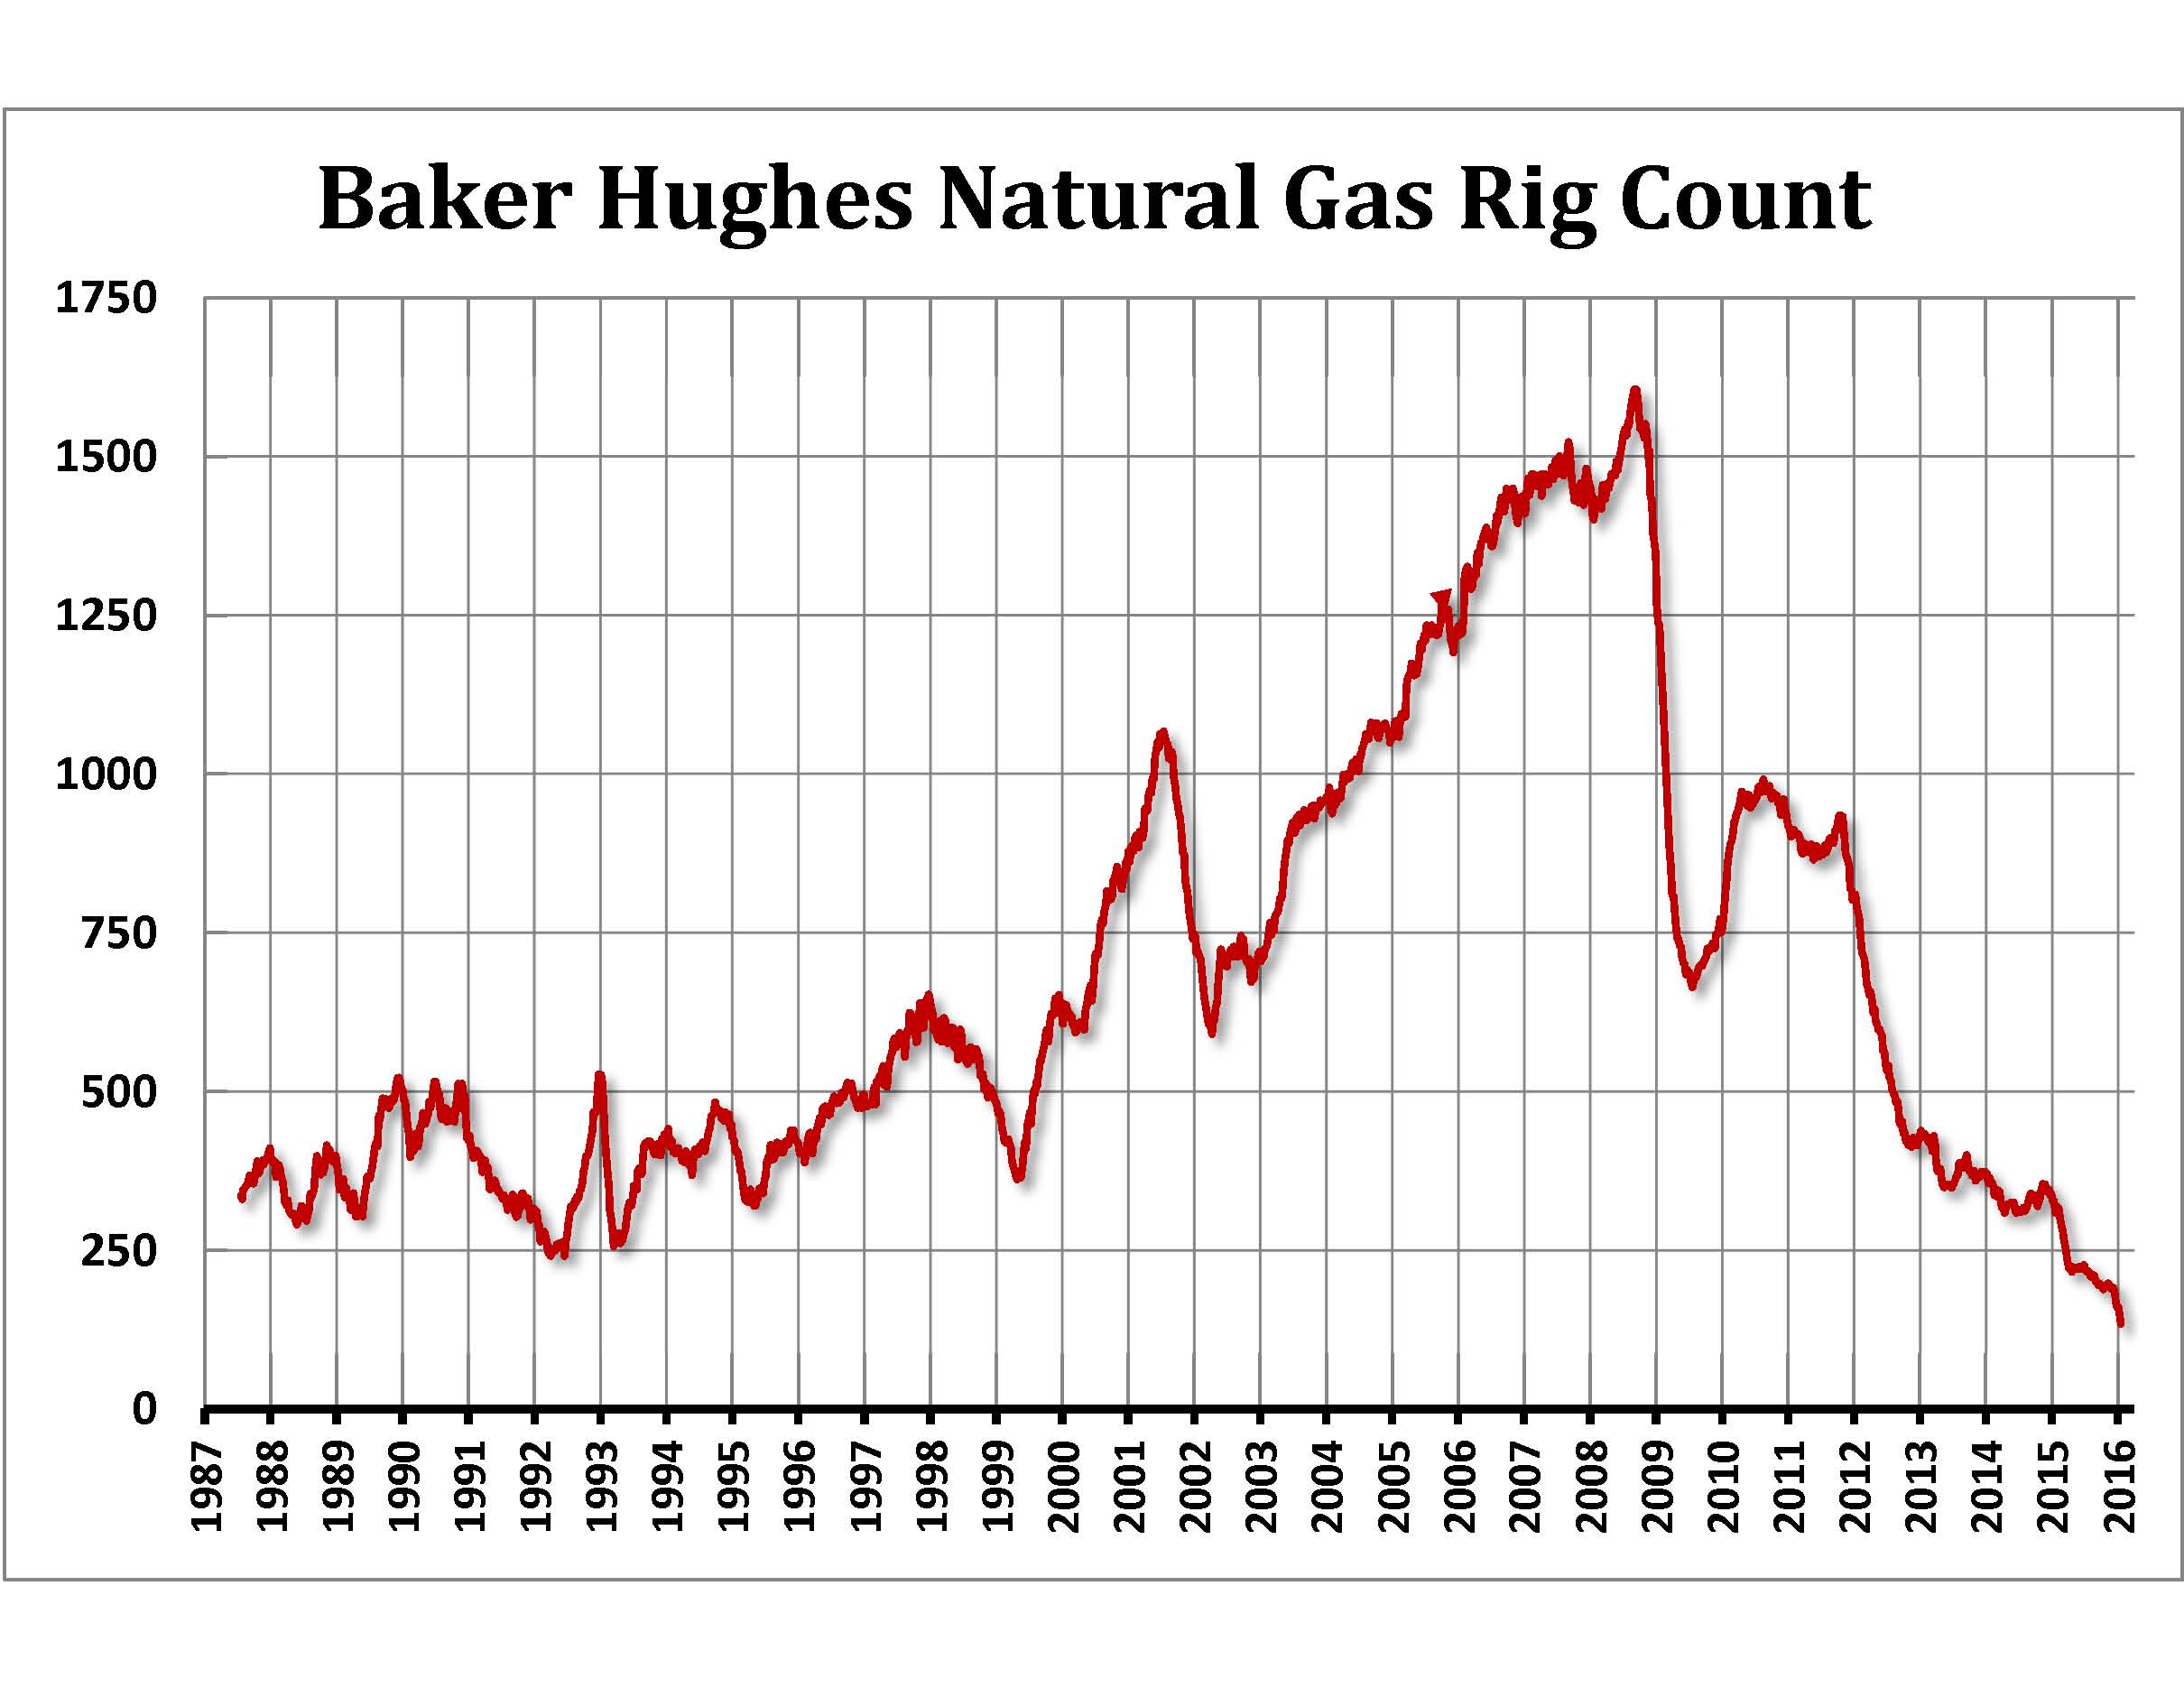
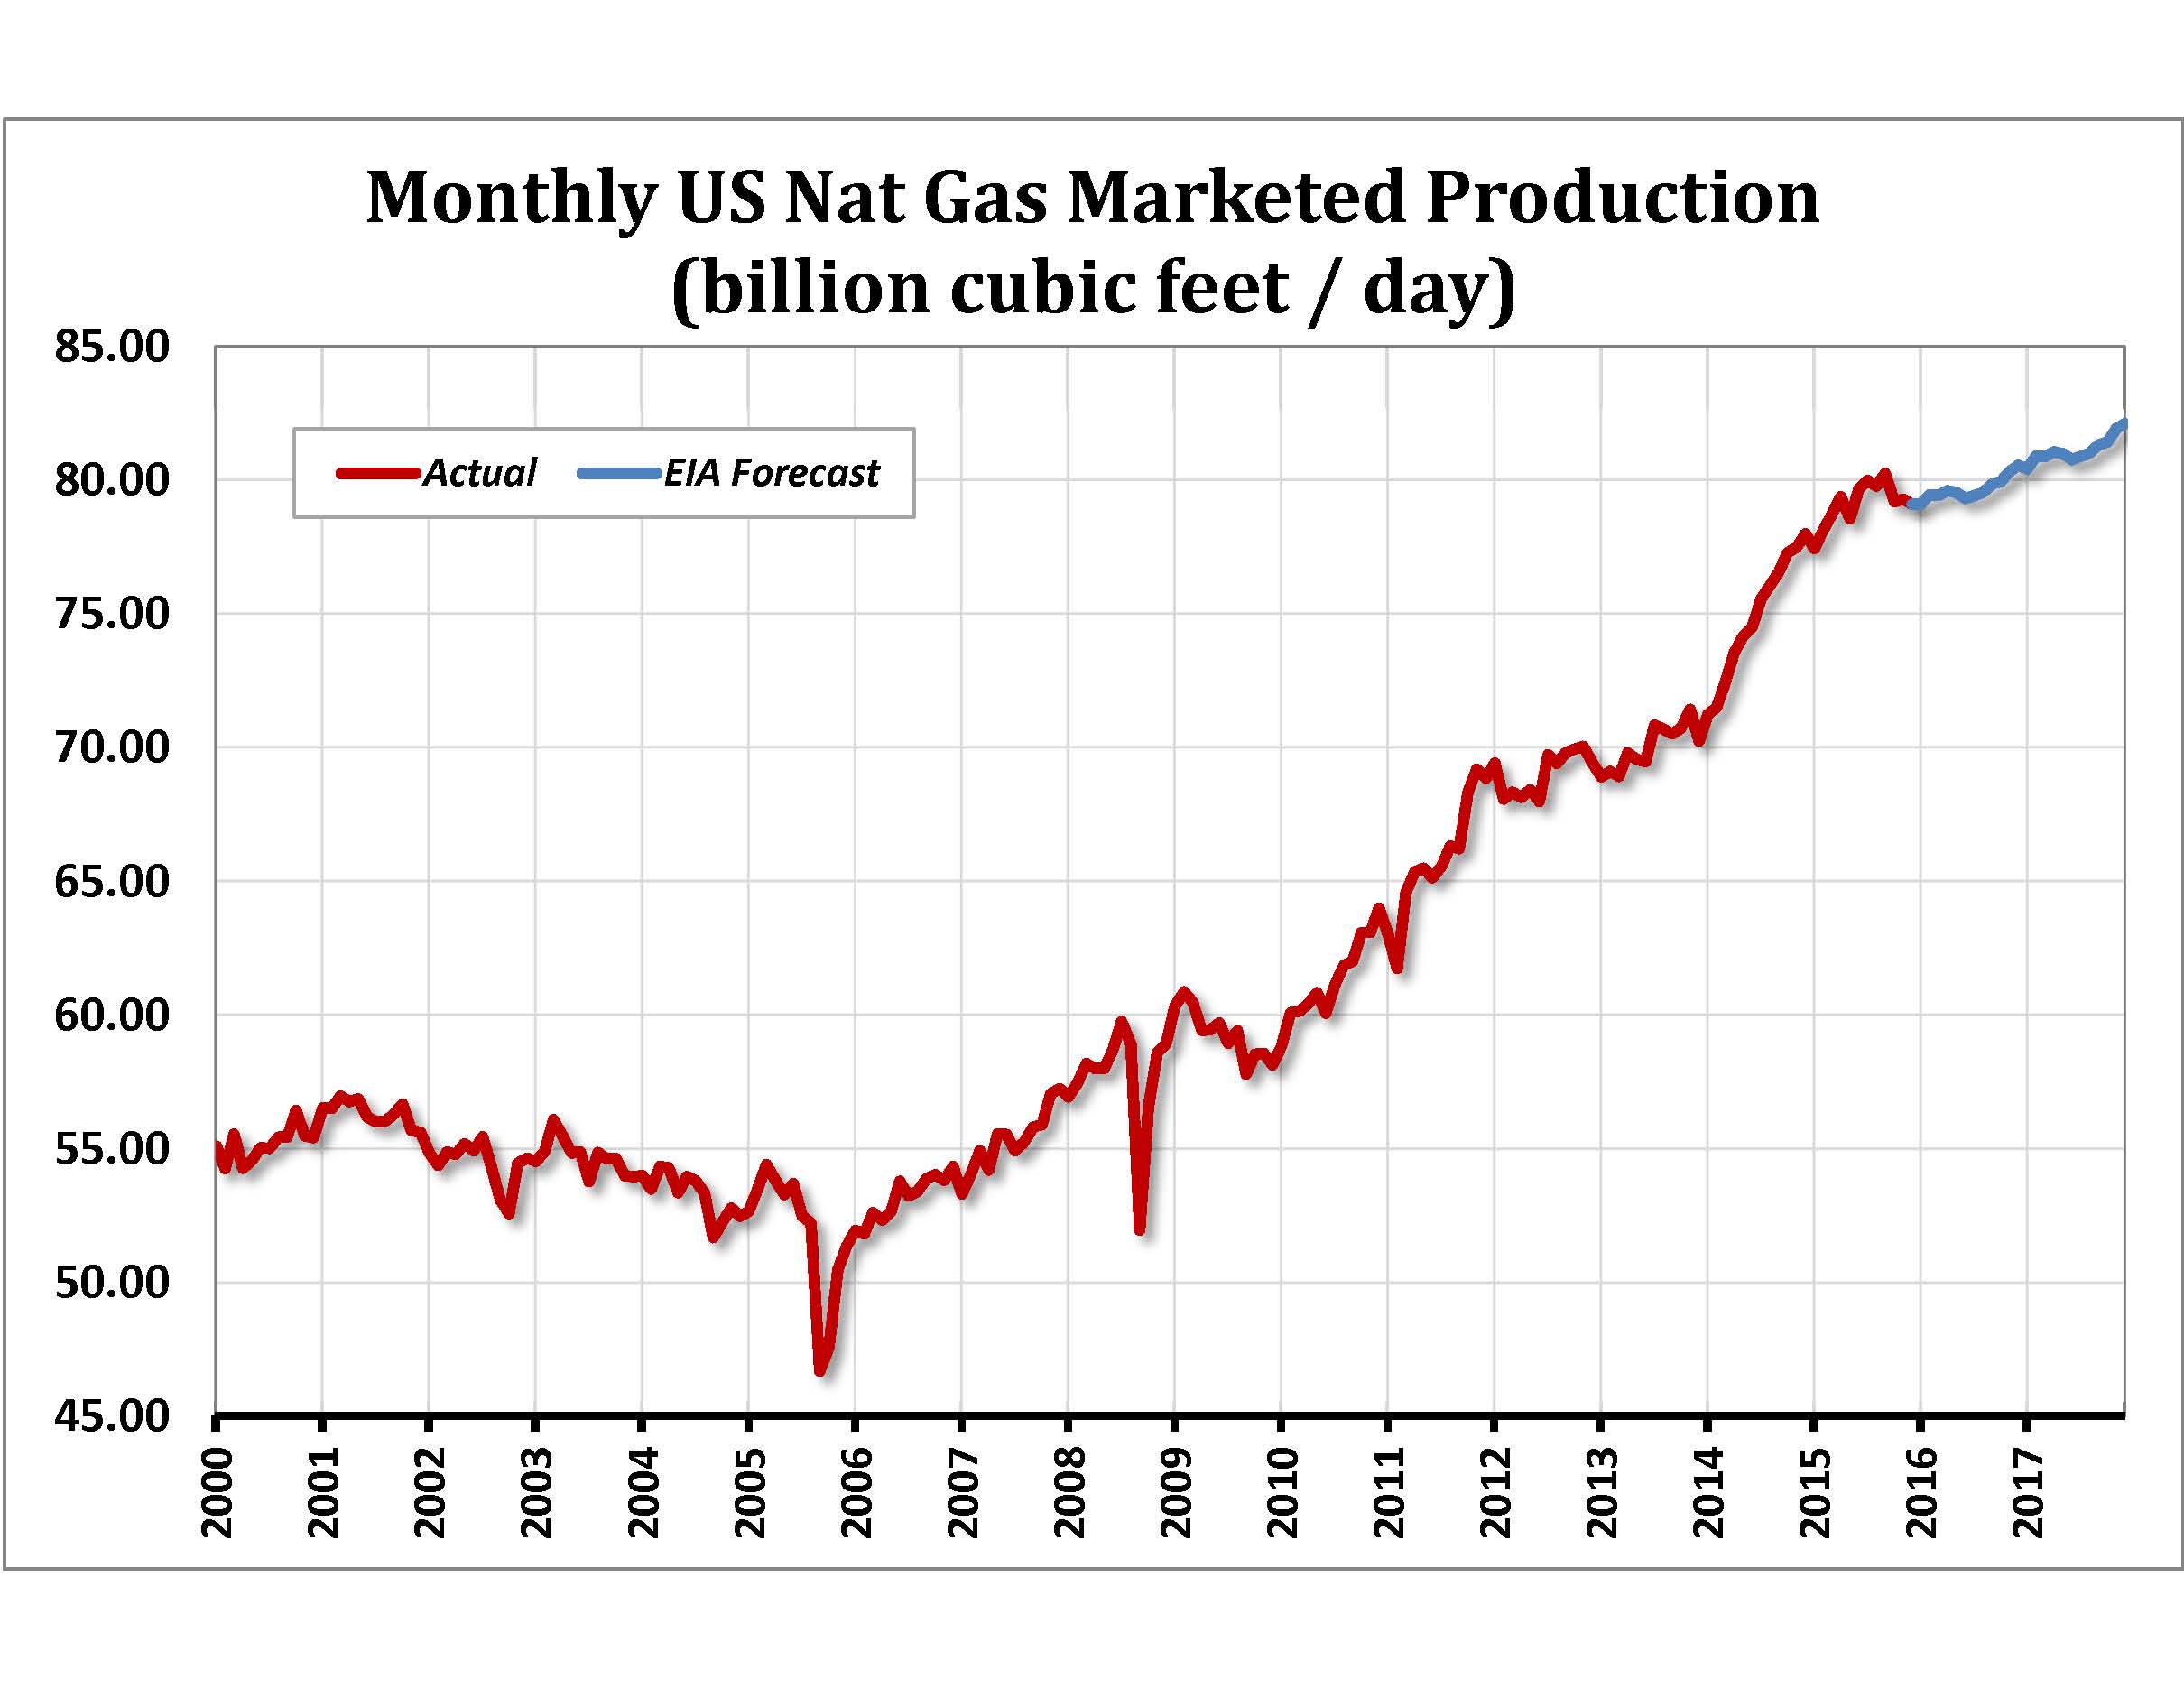
A number of US producers in the Utica and Marcellus shale regions have reduced production. Total natural gas rig counts are falling as well. As of January 2016, the number of US rigs drilling for natural gas had plunged to 135, down 92% from the 2008 record high of 1,606. Production is still supposed to increase in 2016 but at a slower pace. US total marketed production is expected to expand by 1.9%. This is a dramatic slowdown from the 6.2% year-over-year gains seen in 2015.
One of the few bright spots has been the 18.5% increase in power generation demand. According to the EIA, US power burn during autumn 2015 was 25% above the five-year average because of lower natural gas prices and reductions in the number of coal-fired electric-generation facilities. The southern US is the dominant region for natural gas-fueled electricity generation, and if this winter ends up being colder than anticipated, it could bolster the demand outlook. Overall, the EIA is projecting US natural gas demand to increase by 0.2% in 2016.
During the 4th quarter of 2015, the Commitments of Traders data showed speculators holding a near-record net short position. If this holds into 2016, it could fuel some dynamic short-covering rallies, especially if the weather turns unusually cold for any length of time. Rallies in nearby natural gas above the $2.50 level could send shorts scrambling for cover and bring the $3.35 level into focus.
Equity Indices
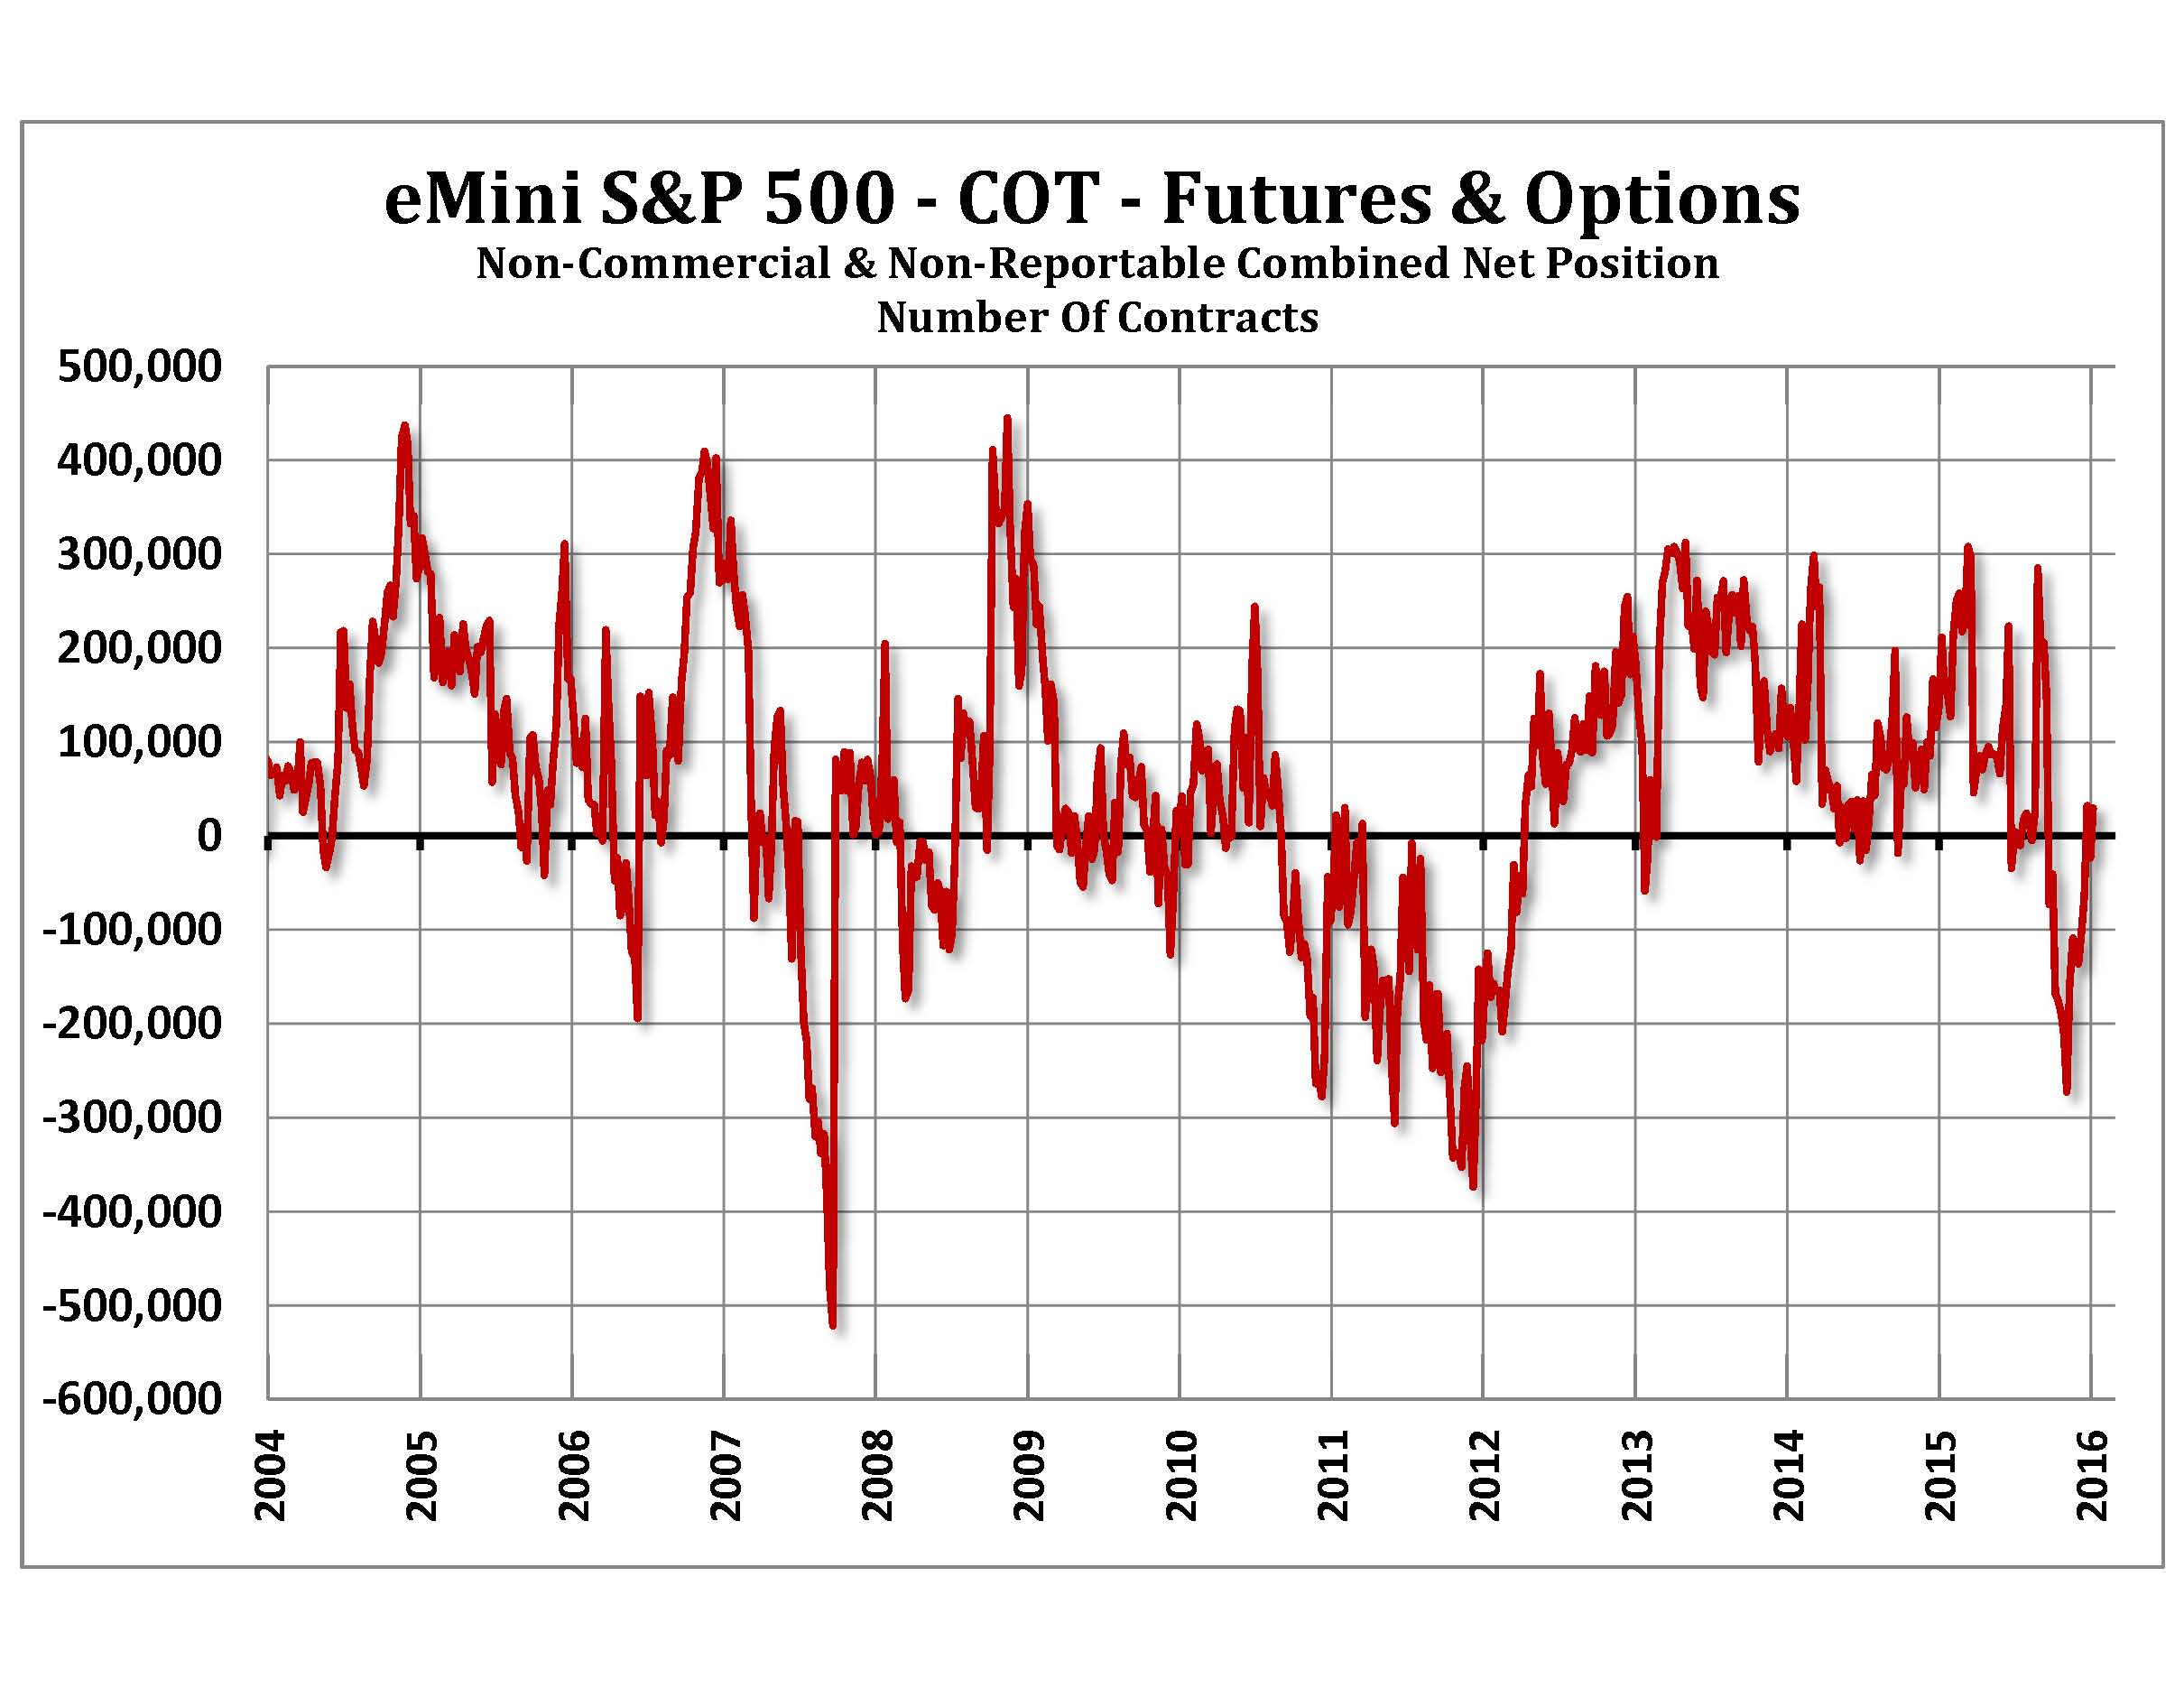
The stock market experienced an extremely poor start to 2016. We think the market already factored in a sluggish economy for the most part. We also think the market has factored in a series of US rate hikes, as various Fed members have predicted there will be anywhere from three to five in 2016. But in order to call for a major bottom in stocks, we would like to see US nonfarm payrolls extend their so-far impressive pattern of three straight monthly gains that they registered from October through December. Furthermore, that momentum has to spread to other sectors of the economy.
A chart of the Commitments of Traders combined non-commercial and non-reportable net position for the E-Mini S&P which provides a good measure of oversold and overbought conditions in the stock market. With the open interest in the E-Mini S&P futures at times reaching as high as 2.8 million contracts, the value of these reports should not be underestimated. As the chart suggests, the market becomes significantly oversold as the net short position approaches 300,000 contracts. Once that position falls into the range of 200,000-300,000 we would be on the lookout for a major low.
As in 2015, leadership is likely to remain with the lower end of the market in 2016, specifically the NASDAQ. High tech stocks should continue to garner the lion’s share of speculative interest and investment going forward. While brick and mortar is likely to continue to suffer, tech stocks should be the least weak on the downside and the strongest performers on the upside.
Currency Markets
The US dollar has been king over the past two years, with currencies like the Canadian dollar, the British pound and the euro facing unrelenting pressure from its historic rise. The dollar rose because the global trade was expecting the US Fed to embark on a series of interest rate increases and the US economy was looking much stronger than most other developed countries.
As of early 2016 the dollar appears to be maintaining its edge, but the tables could turn without a notable pickup in US economic activity. The December 2015 hike in US rates has temporarily damaged sentiment, while the euro zone is finally showing some forward motion.
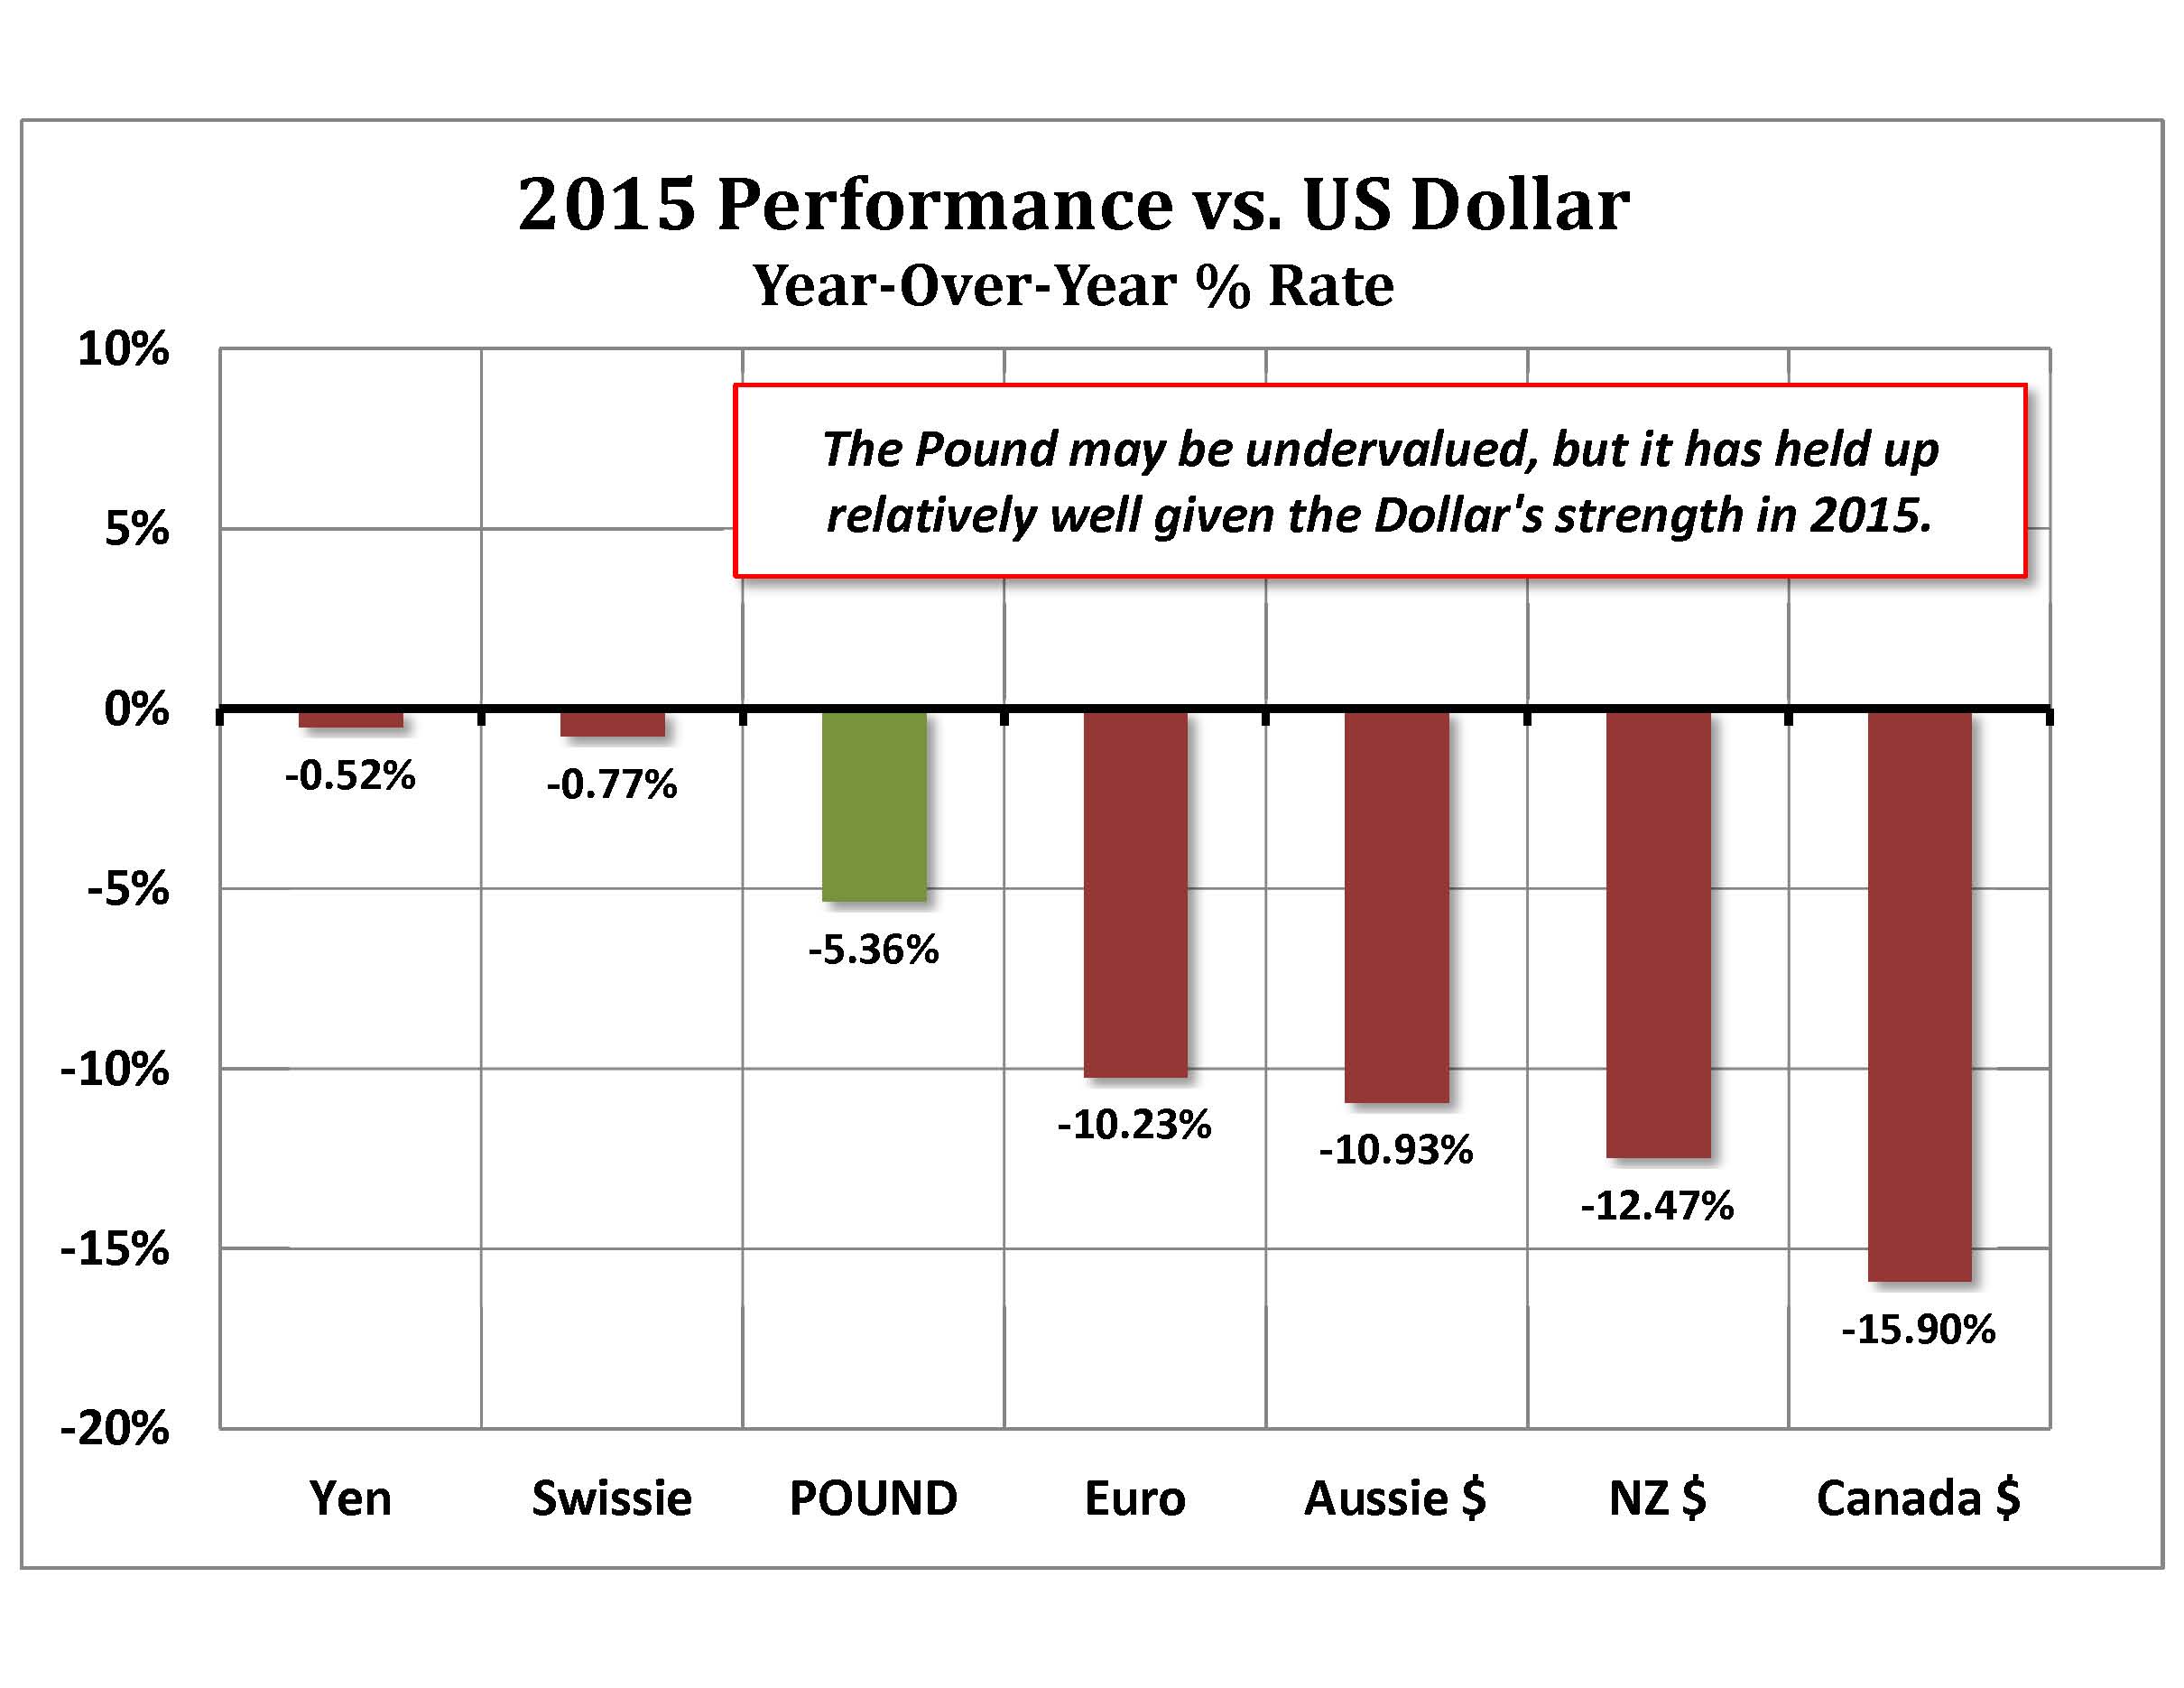
However, it will be difficult for actively-traded currencies to get the upper hand on the dollar, and that could mean the most significant competition might come from extremely undervalued currencies like the Canadian dollar, the Australian dollar and the British pound. If the crisis in China were to delay the global recovery, the dollar would probably end up forging a leg up. However, if China fell into financial disarray, the standard safe-haven flow into the dollar might not take place at all if China is forced to liquidate its US Treasury holdings.
With China and Japan being major holders of US government debt, a developing Asian crisis could result in the liquidation of US assets and significant pressure on the Dollar. If the Chinese situation becomes acute, it is possible that an even older safe-haven instrument, the Swiss franc, might come into favor.
On the other hand, many analysts think a problem in China or a failed recovery effort across the globe would bring in enough buying from non-Japanese and non-Chinese accounts to keep Treasuries and the US dollar supported.
If one looks at long term charts in the yen, Swiss franc and pound, there is some history to suggest major turns in currency exchange rates begin just after the New Year. We suspect that early-year change of trends might be the result of renegotiated import/export contracts at the beginning of the year and also because of annual projections on business trends and long-term forecasting.
As we have indicated a number of times in our daily Hightower Report comments, currencies like the Canadian dollar, the British pound and the Australian dollar have settled into a positive correlation with global equities and the ebb and flow of international growth trends. On days when scheduled data is disappointing, these “recovery” currencies generally slide; days in which the economic data is upbeat tend to benefit them.
The Canadian, Australian and New Zealand dollars have been considered “commodity” currencies for a long time because their economies are so dependent upon commodity exports and tend to gain as commodity prices climb. Commodities were under significant deflationary pressure at the start of 2016, but an improvement in economic sentiment and a better view towards China could result in significant short covering in these currencies.
Gold & Silver
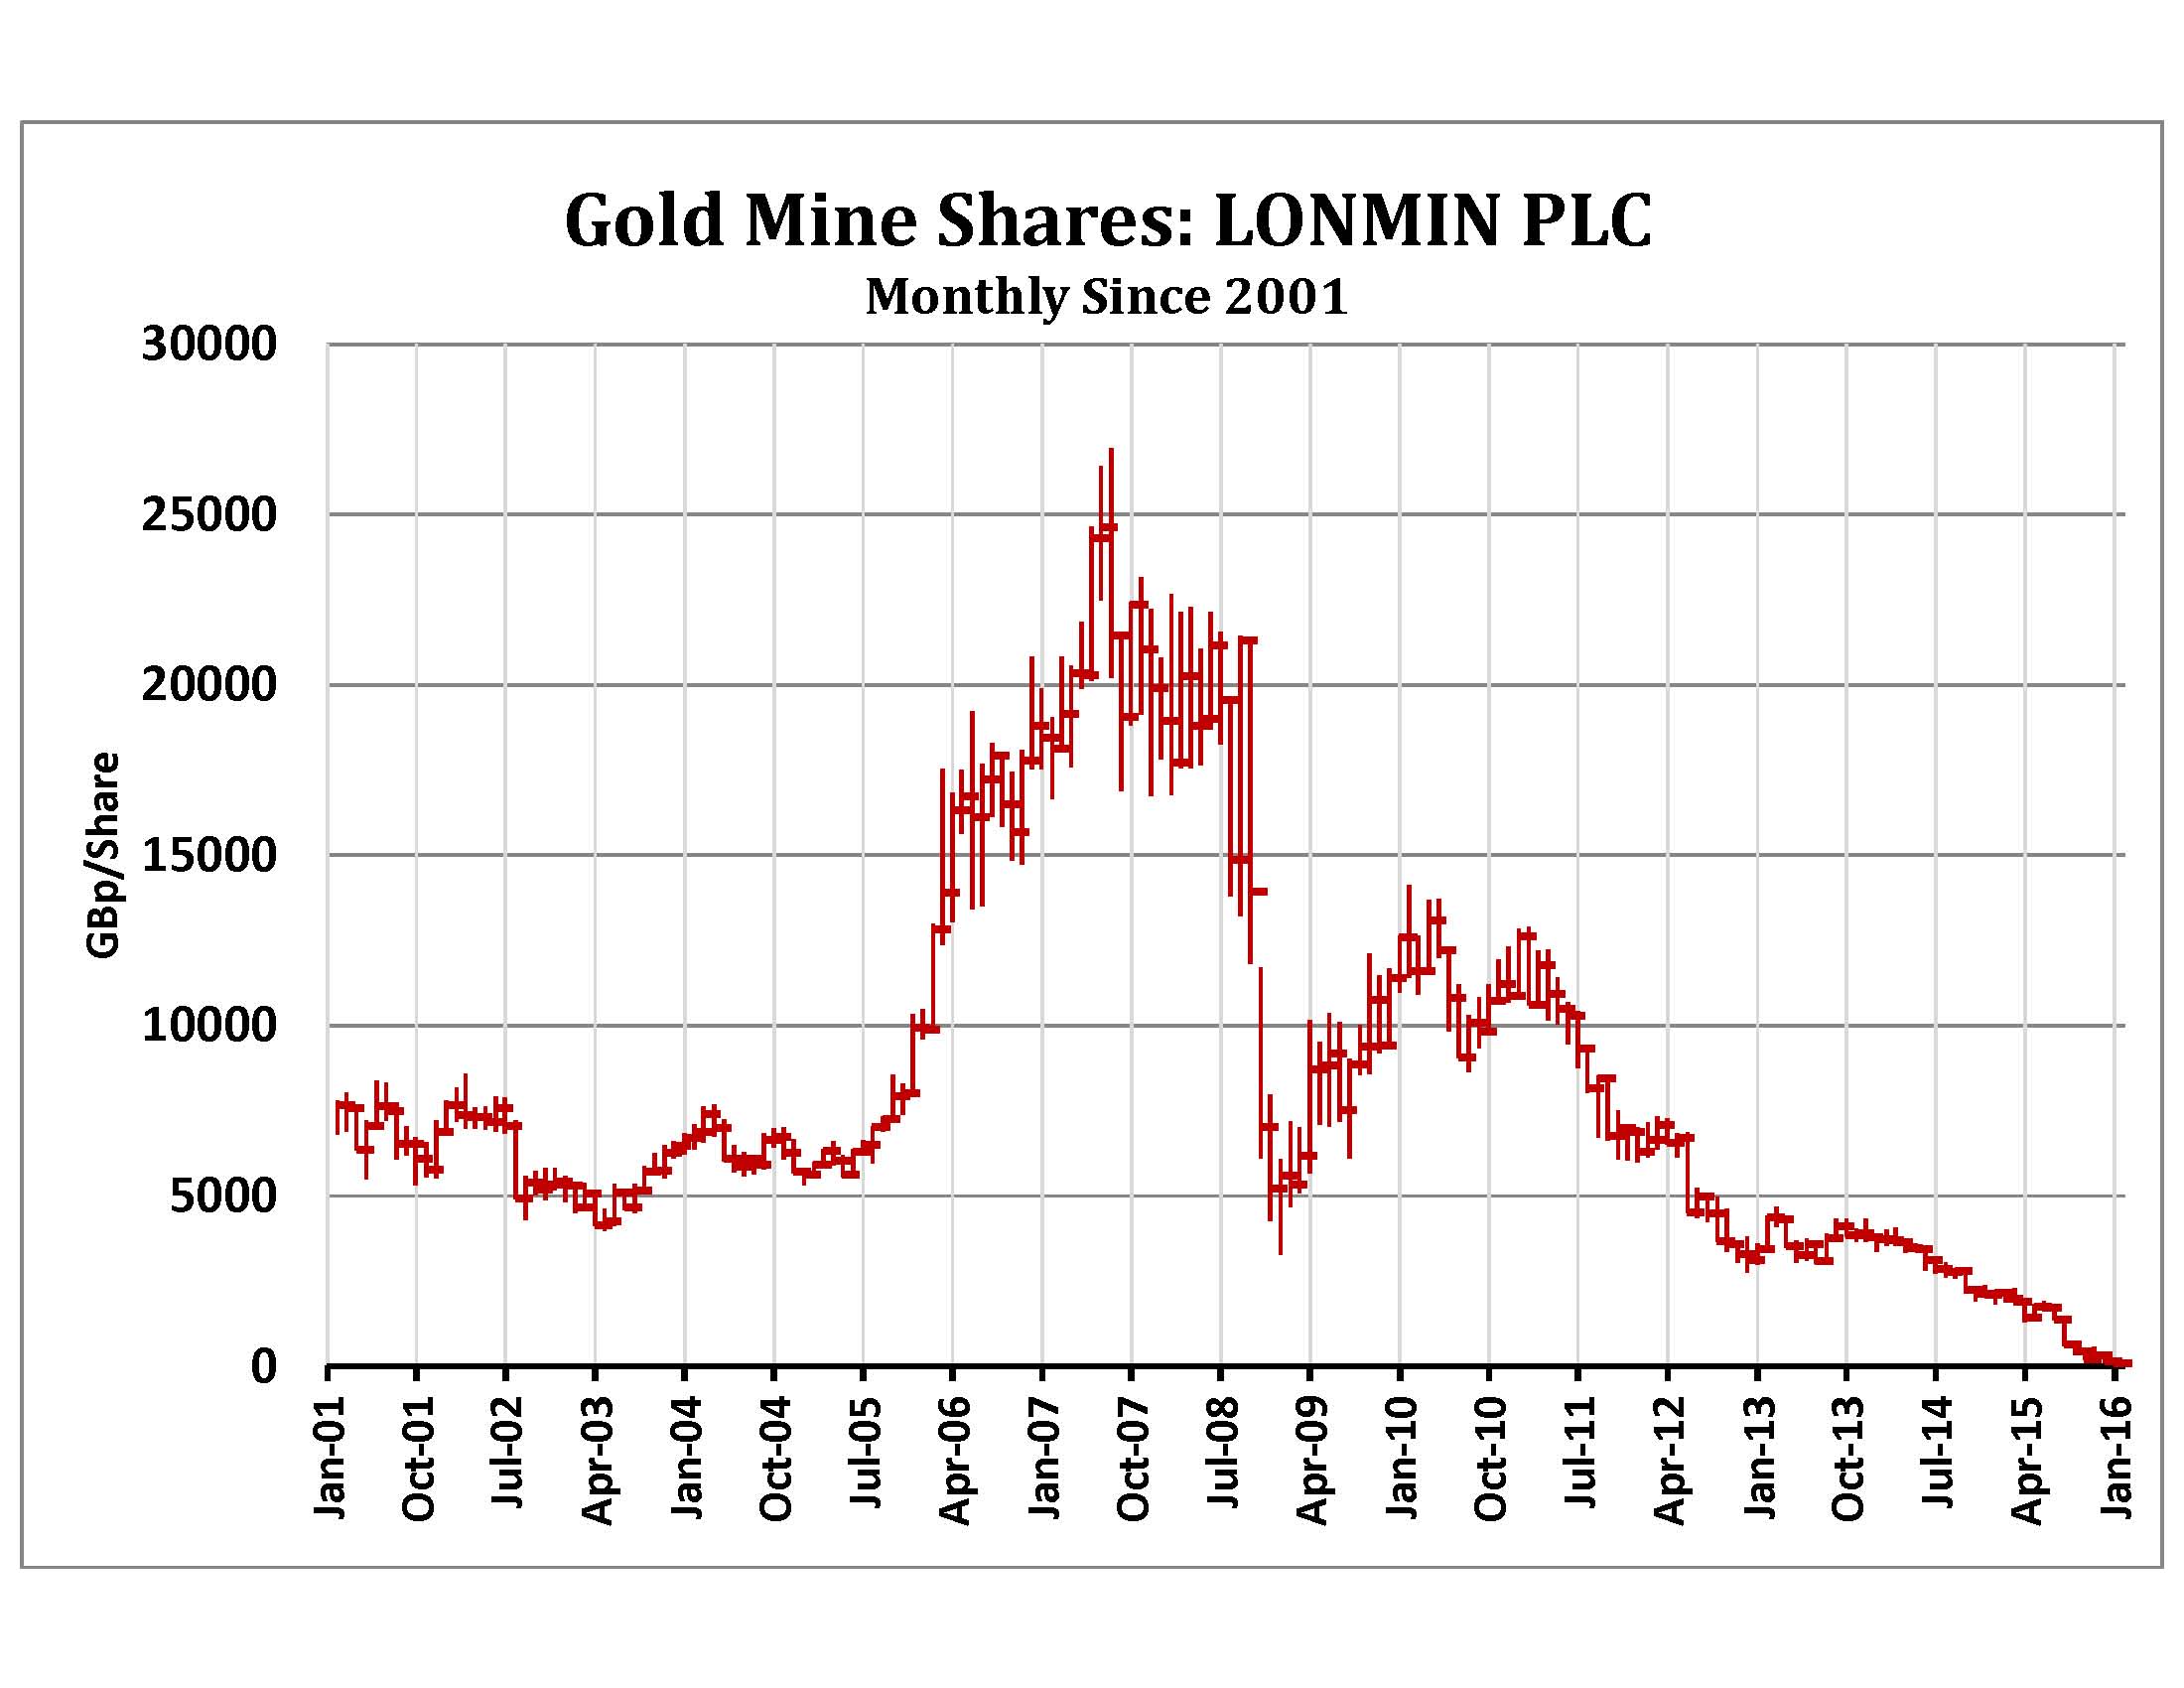
Rampant deflationary conditions and an ultra-strong US dollar were the main culprits for the bearish action in gold and silver in 2015, with ongoing declines in investment interest running a close second. Disappointing global growth, particularly from China, made the magnitude of the price declines possible by keeping demand on a downward spiral. With reduced gold production only partially offsetting declining investment interest, there has been little to cushion prices in the face of severe deflationary psychology. In order to see investment demand expand again, there needs to be a reversal of deflationary conditions and a recovery in crude oil prices. Historically, gold has needed a “story” to spark investment demand, and we think that story will be a series of mineshaft closures or outright failures of mining companies.
While determining the cost of production for gold is difficult due to the wide array of mining conditions (especially with deep mining) and the variances in labor costs, a number of analysts have suggested up to 50% of the world’s mines might already be operating at a loss. Recent wage concessions in South Africa have apparently resulted in wages becoming 50% of total costs. This has left mining companies with little capacity to reduce costs short of idling their production. The headlines have already confirmed sharp declines in capital expenditures and exploration, and that should pull lower supply into the equation in the coming quarters.
Platinum & Palladium
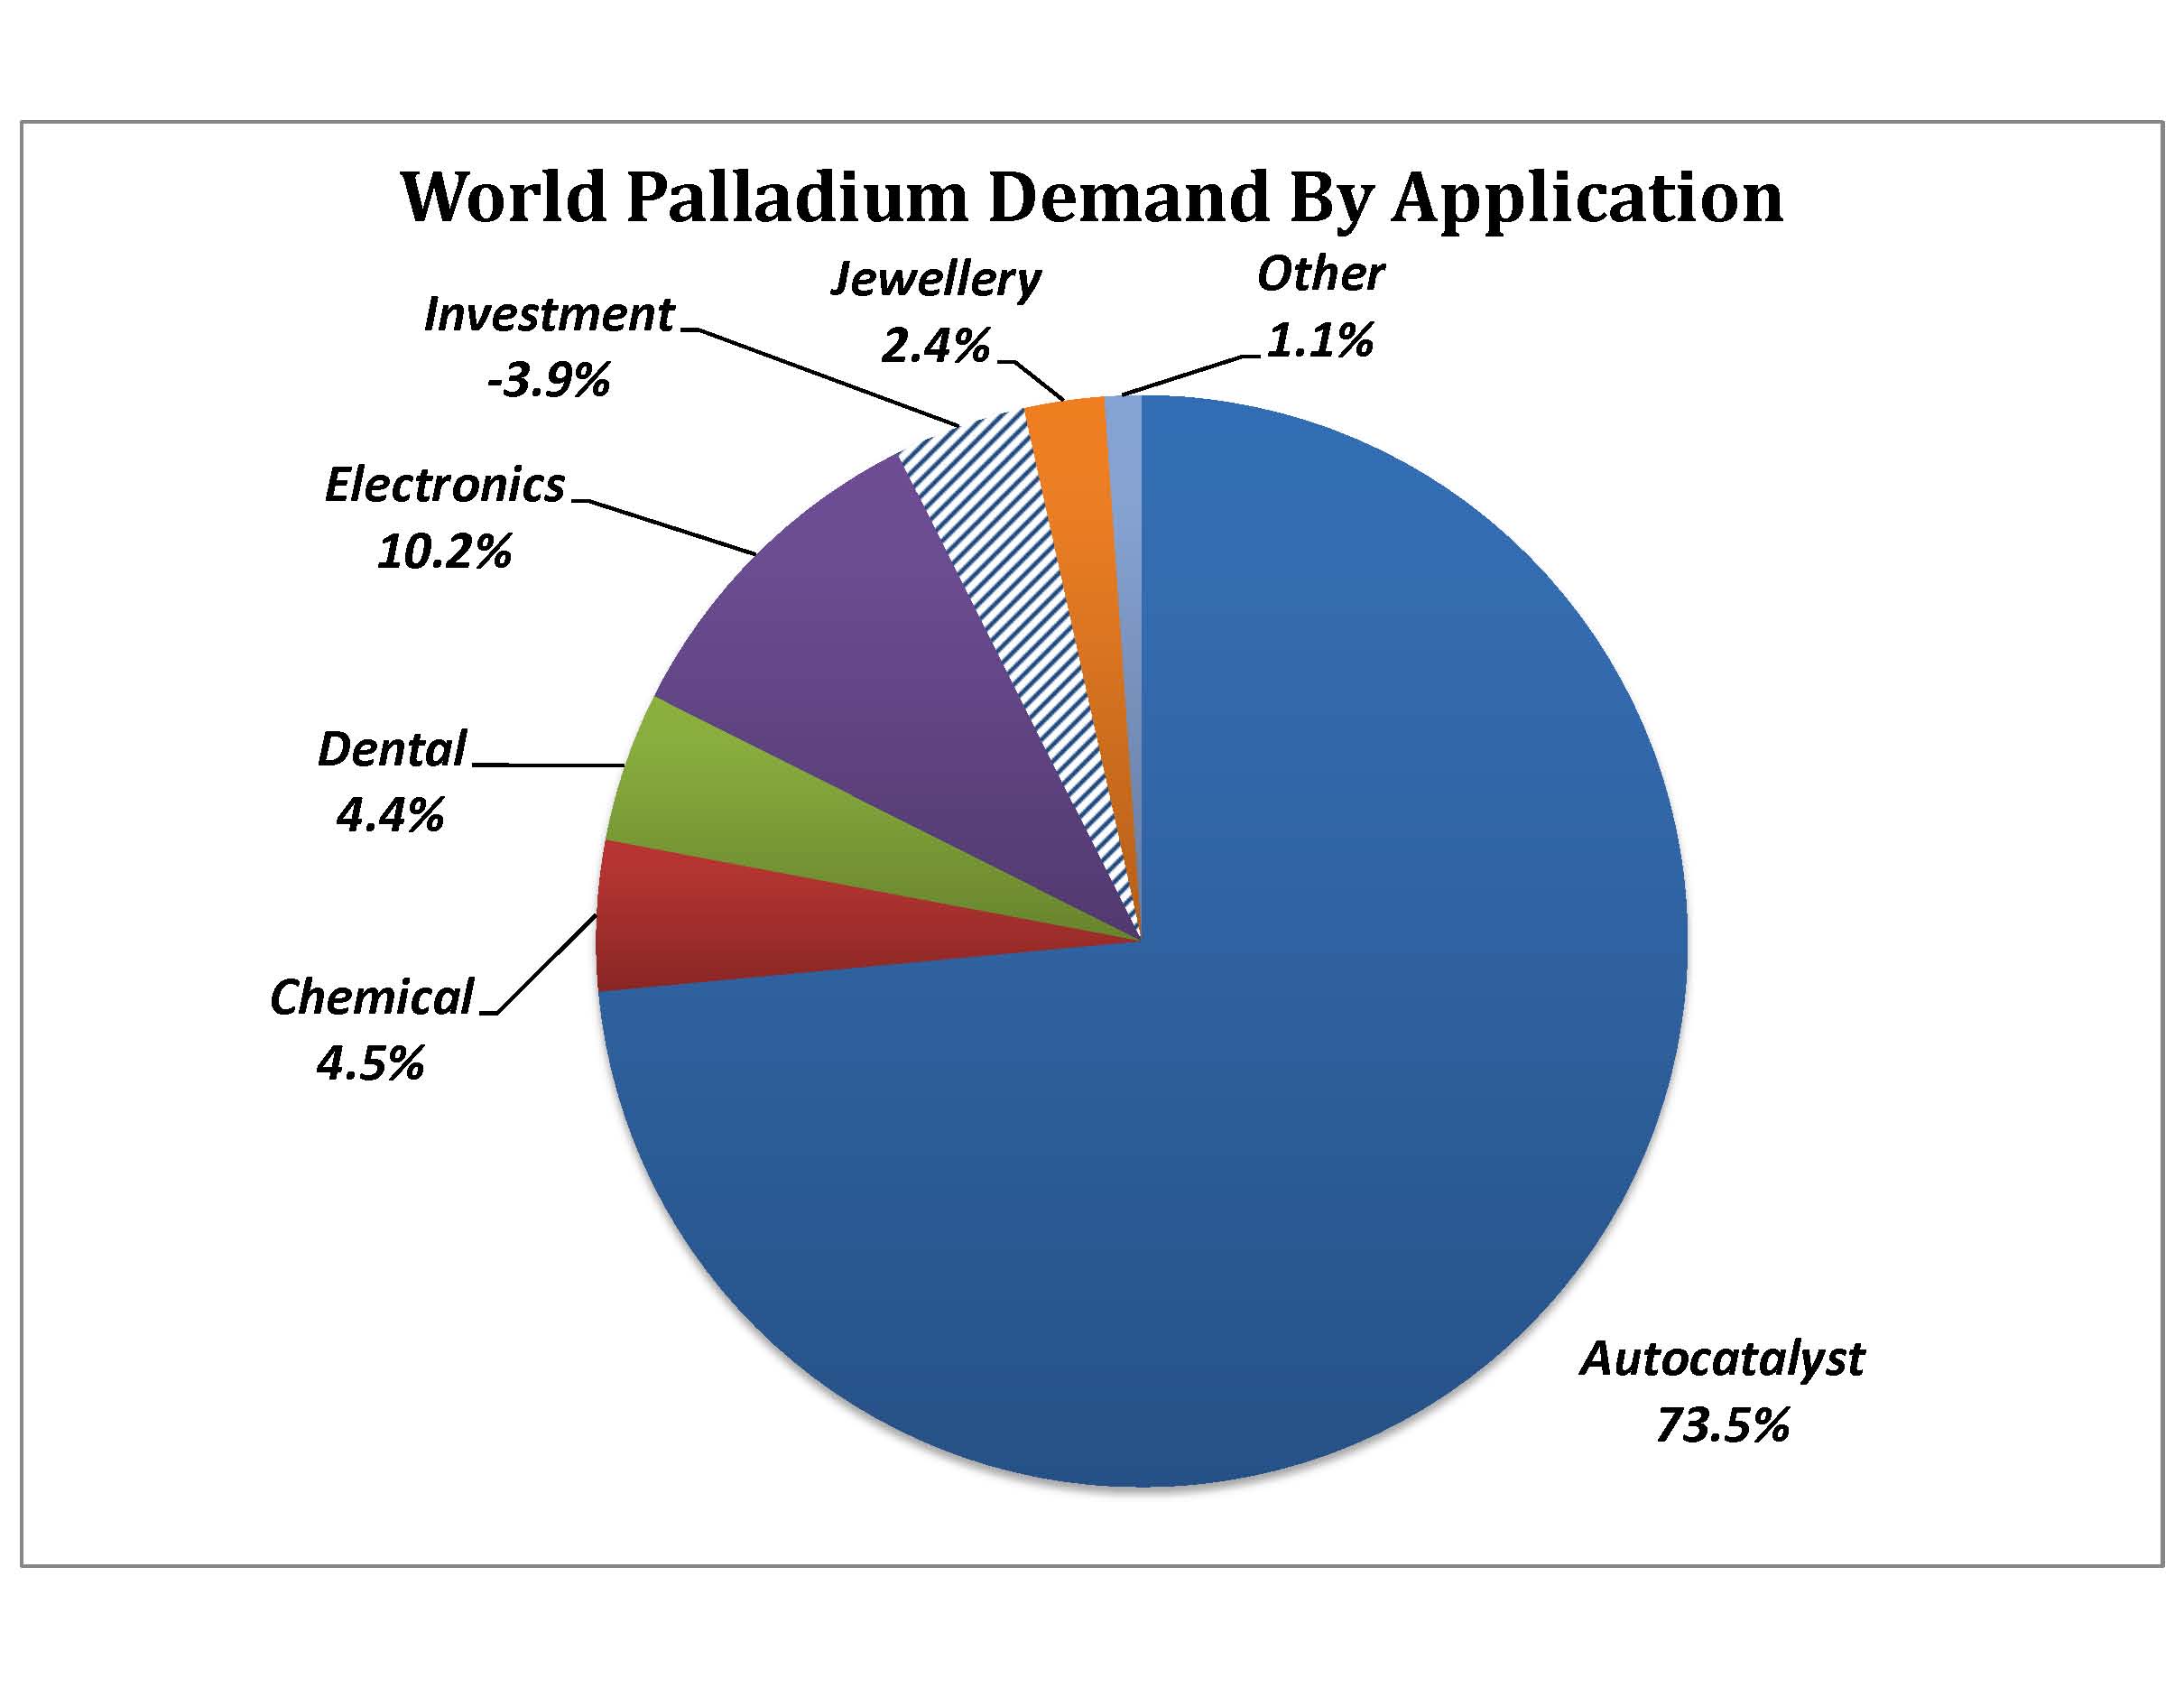
We think the PGM complex offers the most significant opportunity within the precious metals complex in 2016 and perhaps is destined to be one of the stalwart performers of all the physical commodity markets. In some measure we are bullish towards platinum and palladium for the same reasons we are towards gold and silver, namely a developing pattern of declining physical production. Like gold, as many as 50% of PGM mines are thought to be operating at a loss or on a very thin margin. However, the primary bullish factor might be a surprise expansion of auto-catalyst demand for platinum and palladium, particularly in China and India where air pollution problems are increasing as a result of automotive vehicle totals growing along with middle class populations.
Copper
With a record net short position being held by fund traders and small speculators, news from a number of copper miners that they will cut back on production in 2016 and that Chinese copper ore imports were at the highest level in almost two years in November 2015, the copper trade seems to be rushing to factor in what would appear to be a conclusively bearish case. However, China’s auto sales in 2015 were up 8.5% from the year before. Their sales in December were up 17%, so perhaps the negative view towards Chinese copper consumption has gotten overdone. Traders should also note that a flurry of copper miners threatened to idle production on the initial decline below $2.20 per pound, and with the slide below $2.00 in early 2016, we would expect to see even more production idled in the weeks and months ahead.
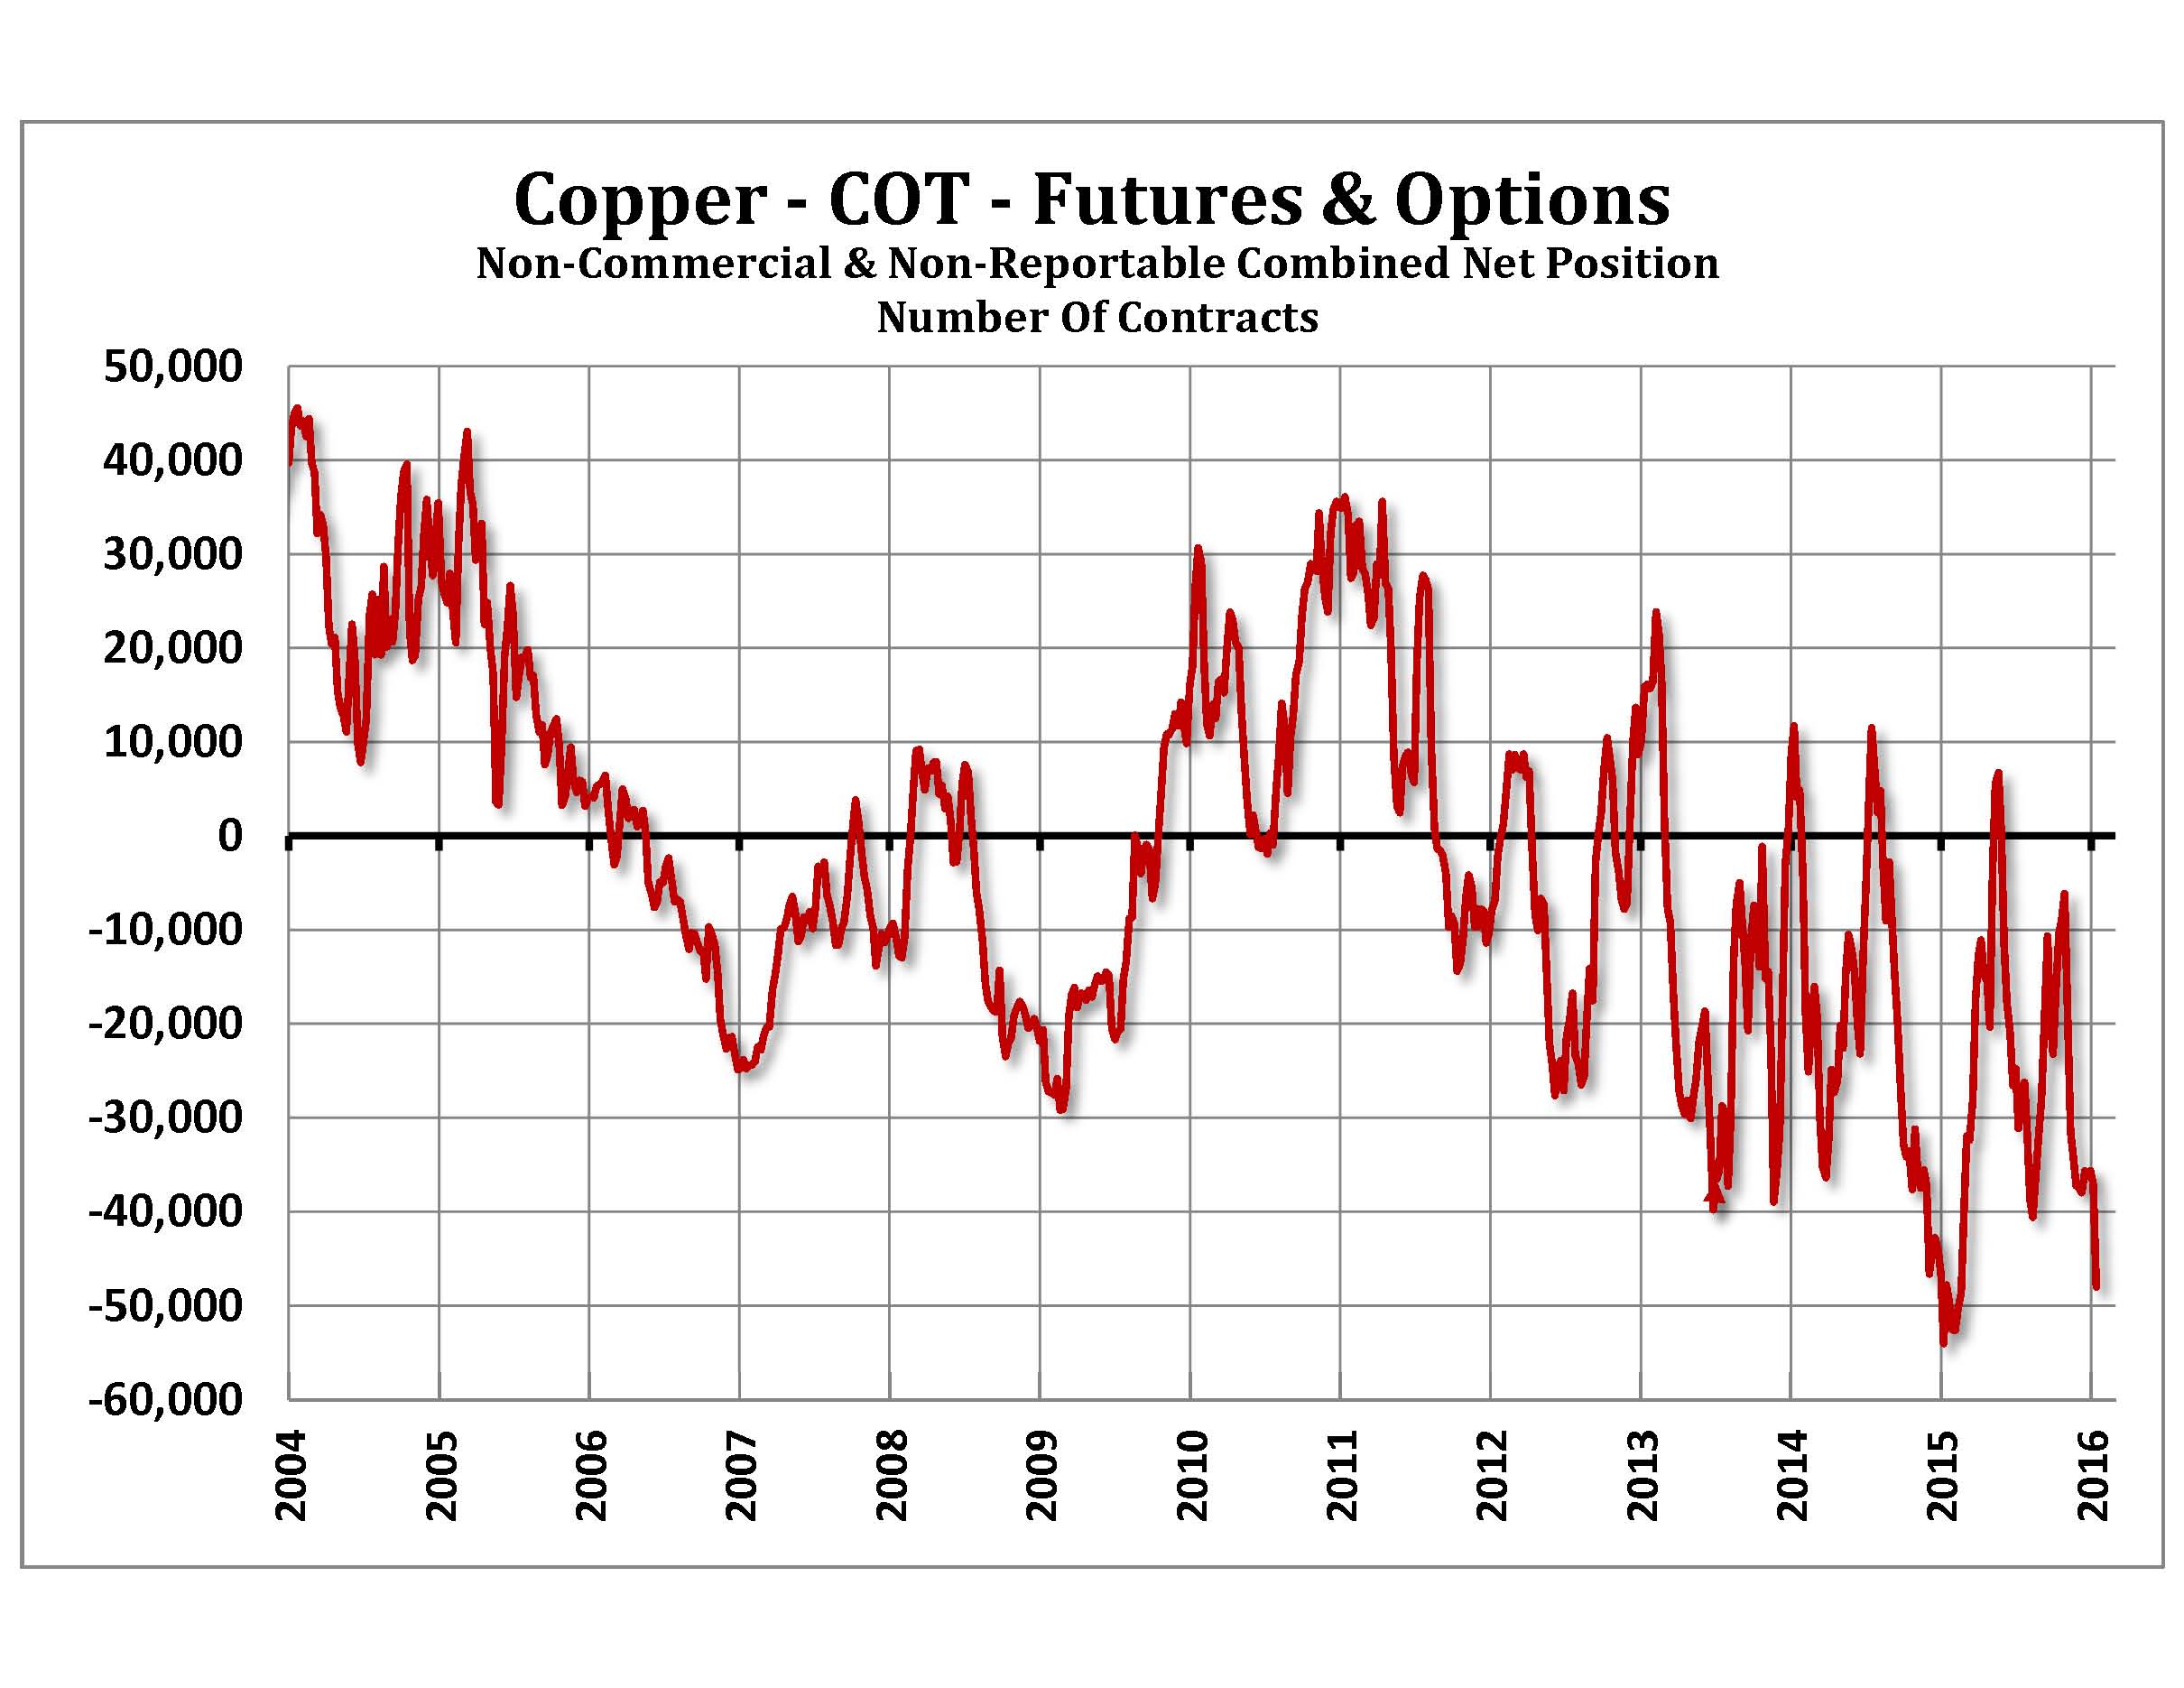
If prices fall into the $1.80 to $2.00 range, we would think the bearish supply and bearish demand expectations would be factored into prices. However, we could see the downtrend extend below those levels if copper has to endure capital or margin-based liquidation.
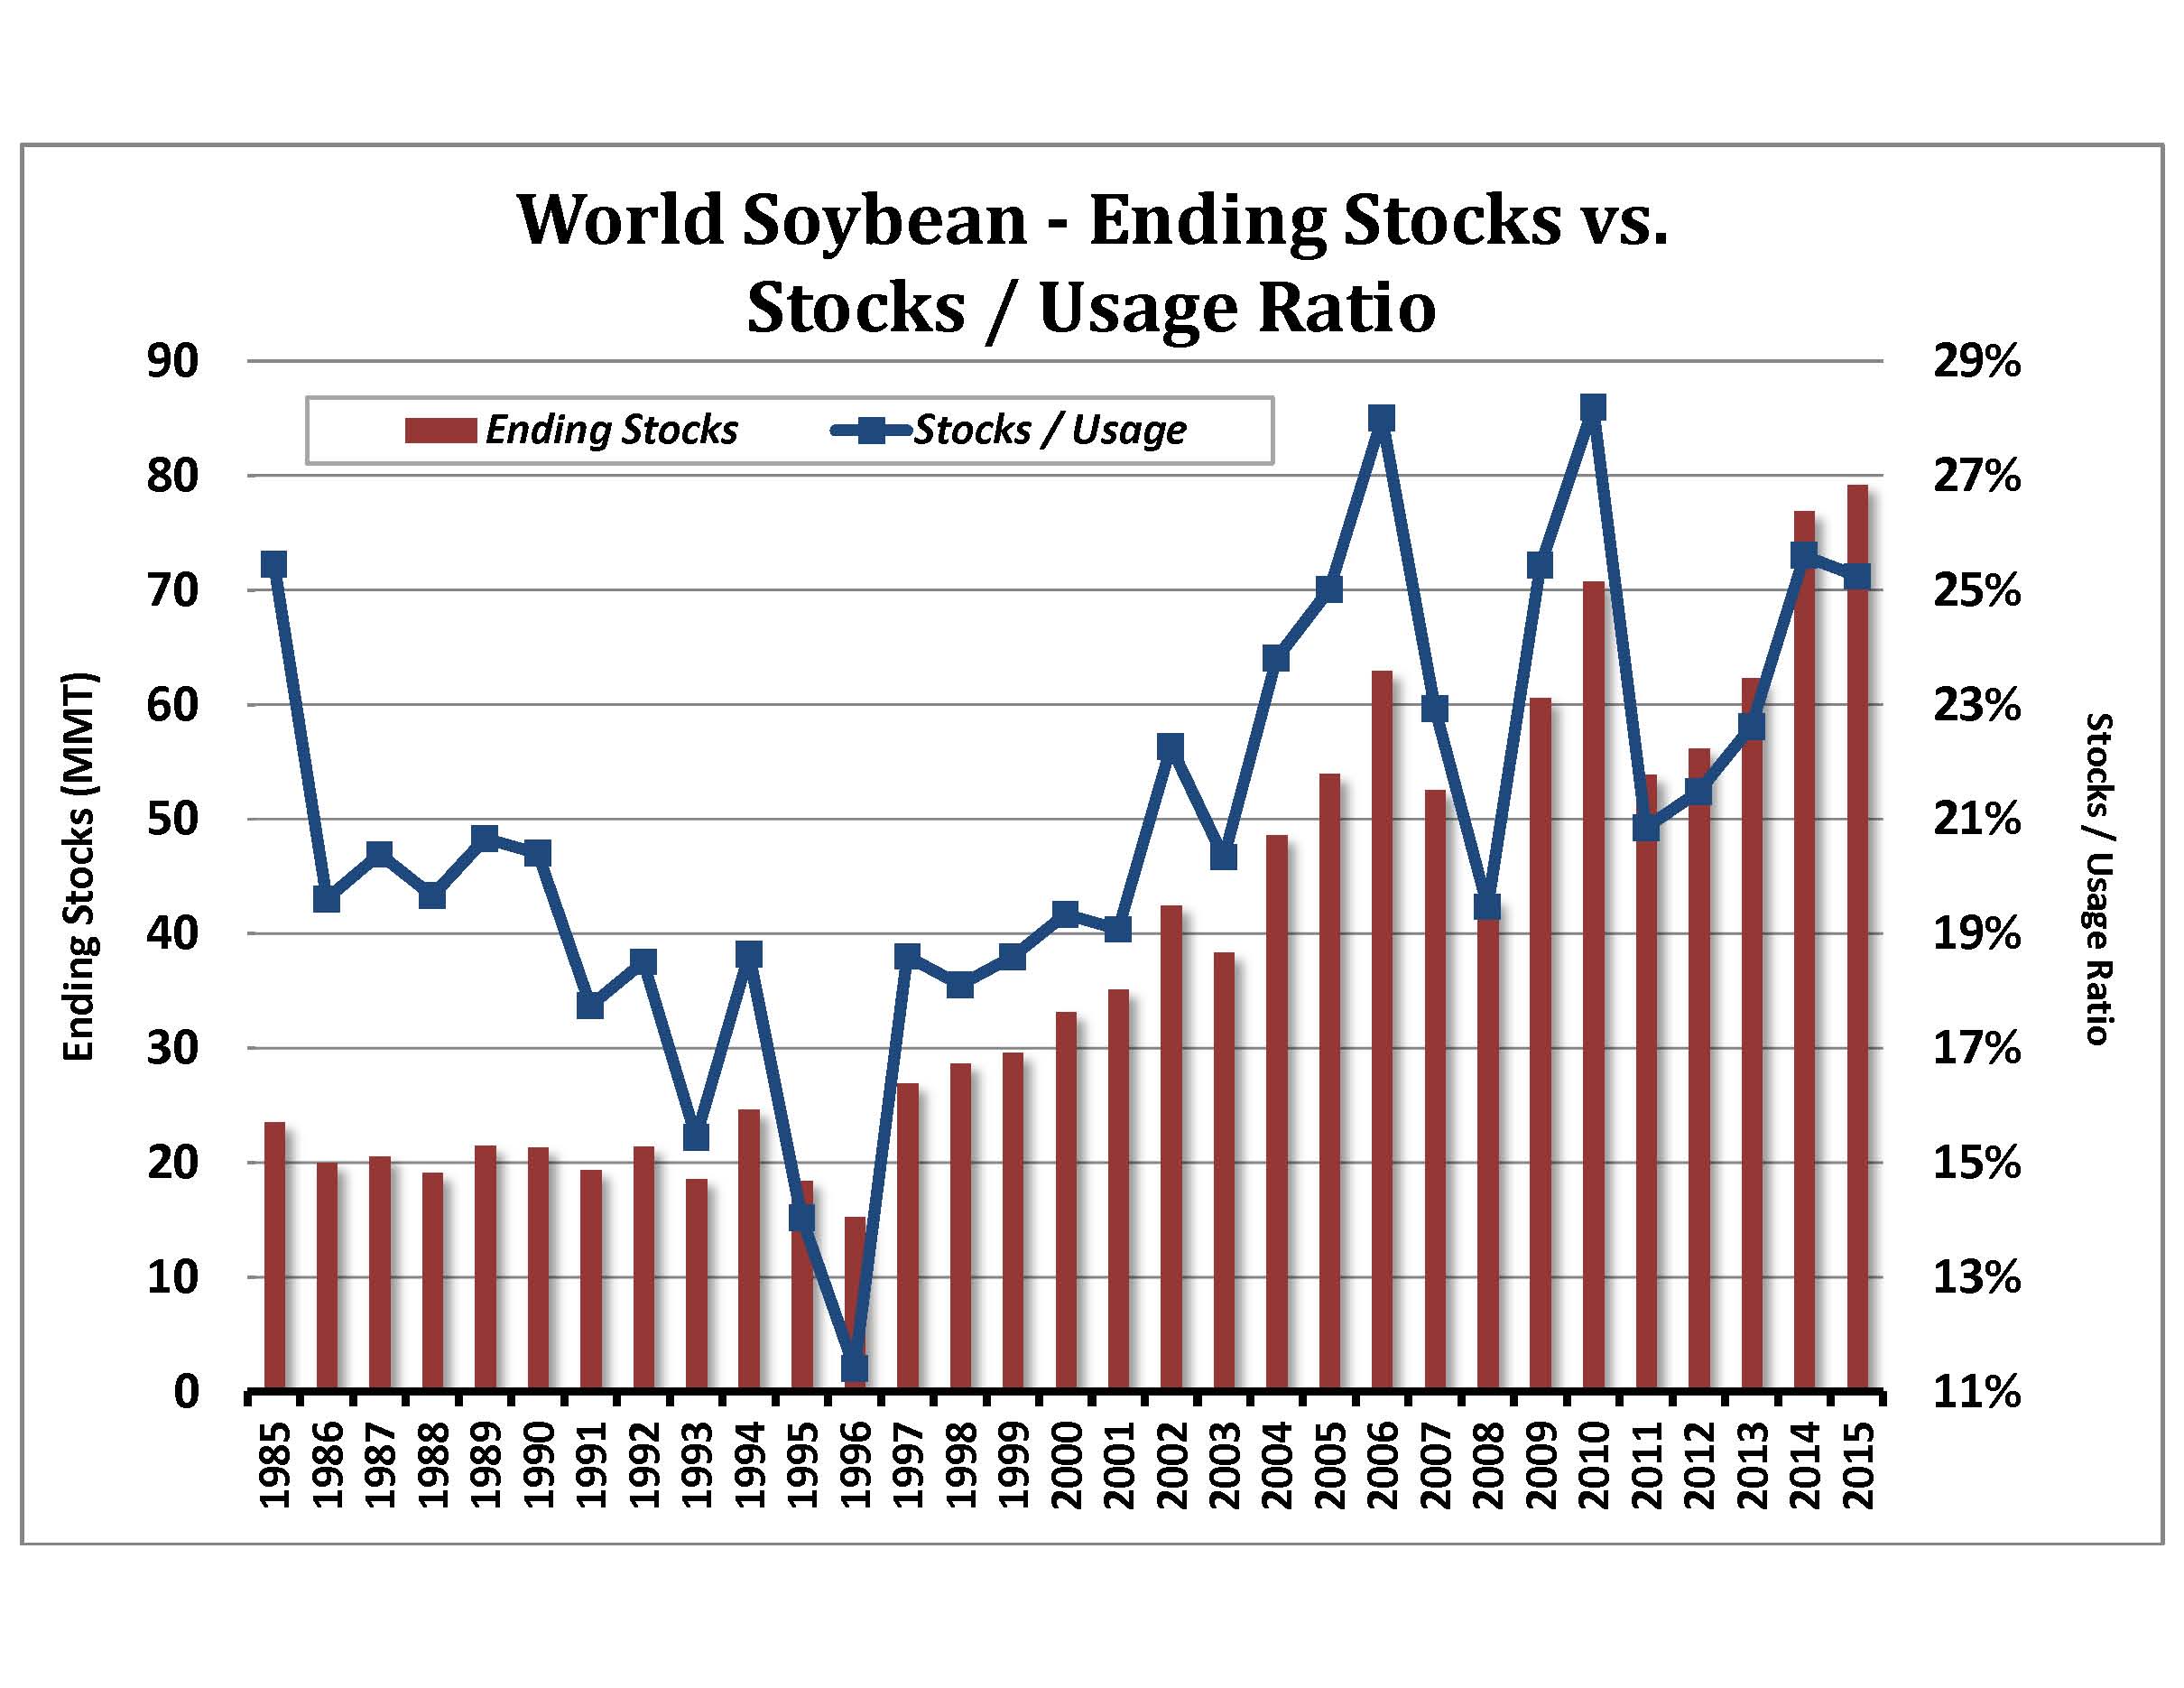
Soybeans
The soybean market looks vulnerable to a resumption of the downtrend in early 2016, as the dry areas of Northern and Central Brazil are forecast to receive normal rainfall for the first half of January. We continue to believe the trade is underestimating the potential aggressive selling from Argentina with producers sitting on two to three years of stocks. Keep in mind that beginning stocks in Argentina are sitting at a record high, and they may want to sell soybeans before the Brazilian harvest season begins. The dryness in December had traders expecting as much as 20% of the Brazilian crop to be in poor condition. If the weather turns normal in the early part of 2016, the crop could be back on track for record-high production. World soybean stocks are at record highs, and if Argentine producers turn more active and the Brazilian crop stabilizes, it may be difficult for sellers to find new buyers at current prices. Argentine officials want to see more aggressive grain selling because they need to bring in more US dollars soon.
Soybean Oil
The global vegetable oil market fundamentals look supportive for the first half of 2016. Palm oil production should see a significant decline from 2015, as dryness that El Niño has brought to Southeast Asia should hurt production. However, in order for this bullish scenario to stay promising, significant dryness will need to return to the region for the January to March timeframe, as rainfall levels improved significantly during November and December. So far, vegetable oil production deficits from key importers like India and China are much higher than in previous strong El Niño years. If palm oil exports are reduced by 5% for 2016, other vegetable oils will need to fill a void of as much as 2.15 million tonnes. Argentina typically exports around 5 million tonnes of soybean oil per year, and the US exports around 1 million tonnes. Malaysia and Indonesia export 18 million and 25 million tonnes of palm oil, respectively. Attempting to make up a shortfall in palm oil with soybean oil could be difficult, and we could expect soybean oil prices to be bid higher in the process.
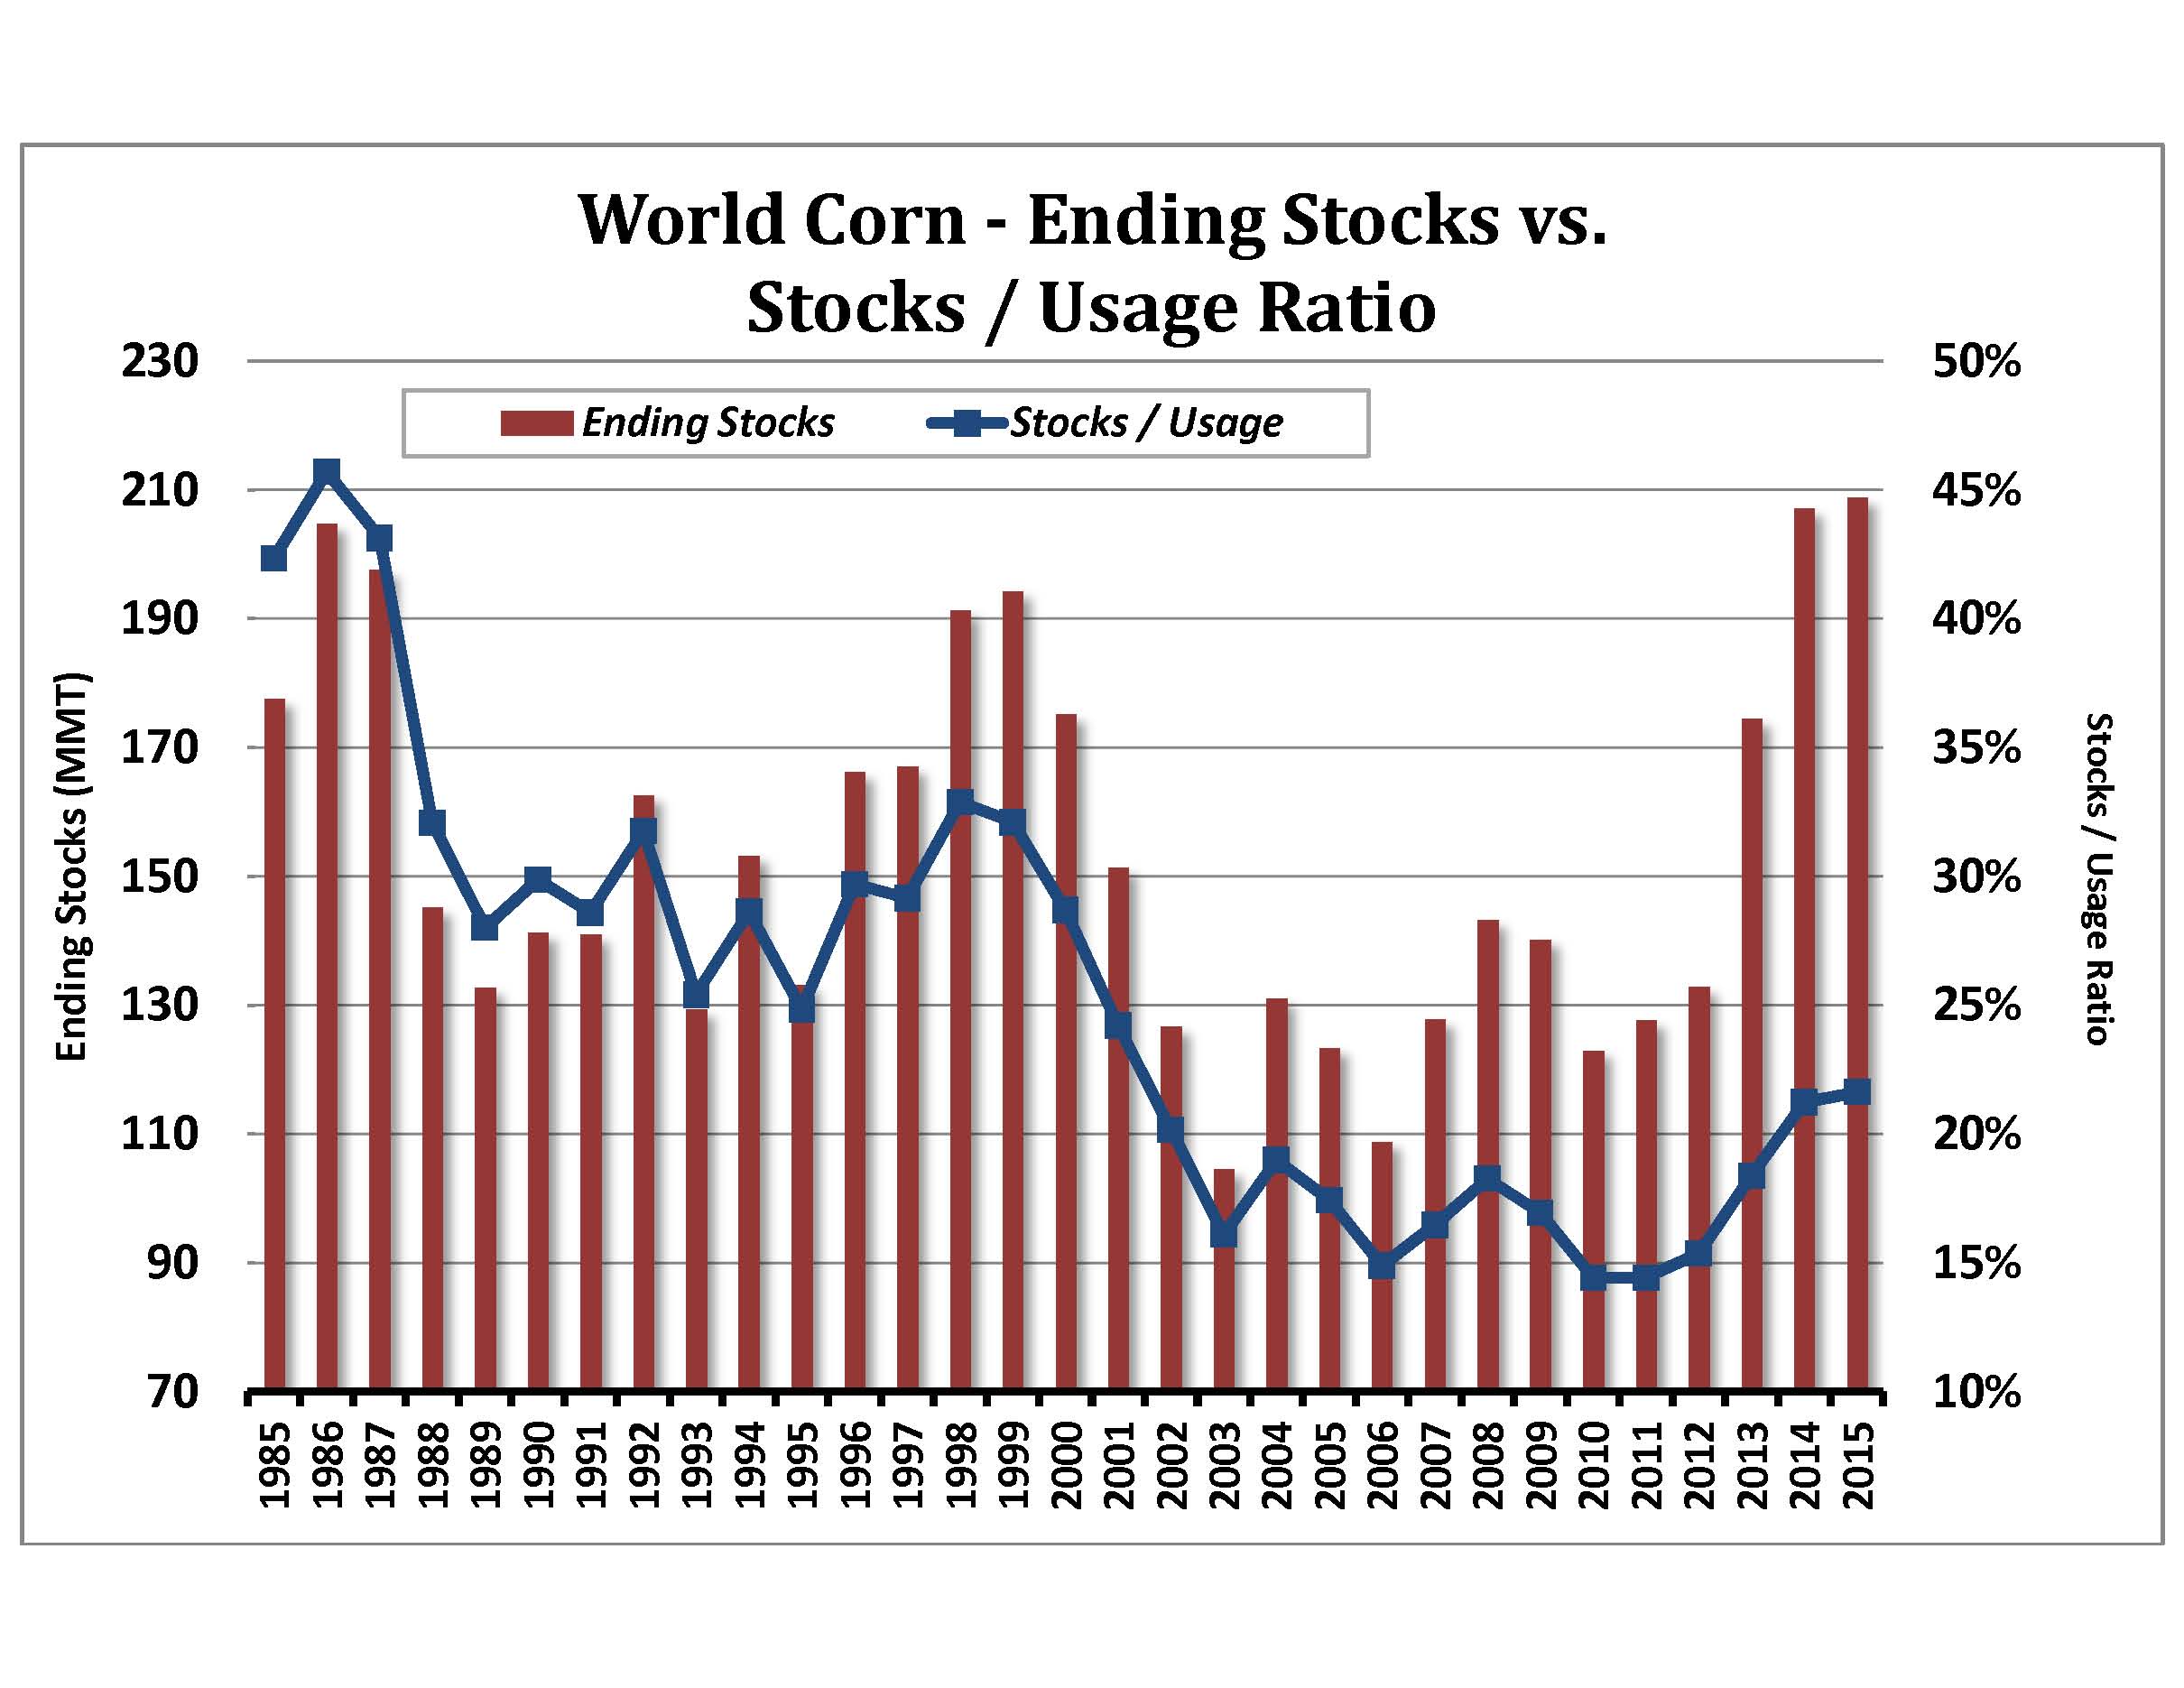
Corn
Corn appears to be the cheapest grain on the board with respect to their cost of production, and prices are low relative to where they have been over the past seven years. The market is seeing ongoing demand from ethanol, and its ending stocks projections are not nearly as bearish as soybeans and wheat. Just as the $2.00 level was strong value in the 1998 to 2006 time frame, and the $3.00 to $3.50 level was considered a value from late 2006 through 2010, we suspect the $3.50 level will ultimately be seen as strong value in the 2014 to 2017 time frame. Surging world ethanol demand might not be able to propel corn prices higher in the face of good weather and a slow global economy, but it can be expected to chew through excess supply. Granted ending stocks are high, but prices are low to reflect that. And the stocks to use ratio shows supplies are not so burdensome. We think corn could become an outstanding value on a decline below $3.47 on the nearby charts and a rally back to $4.40 should not be ruled out in 2016.
This report includes information from sources believed to be reliable, but no independent verification has been made, and we do not guarantee its accuracy or completeness. Opinions expressed are subject to change without notice. This report should not be construed as a request to engage in any transaction involving the purchase or sale of a futures contract and/or commodity option thereon. The risk of loss in trading futures contracts or commodity options can be substantial, and investors should carefully consider the inherent risks of such an investment in light of their financial condition. The data contained herein is subject to revision; independent verification is recommended. Any third party opinions regarding this report are not necessarily those of the authors. Due to the volatile nature of futures and options markets, the information contained herein may be outdated upon its release.